
To Fertilize or Not to Fertilize: Soil Testing and Nutrient Management
Why Test?
- Provincial recommendations:
- Annual crops → test every year
- Perennial hay/pasture → test at least every 3 years
- Best tools: Soil tests and tissue tests to guide fertilizer and manure applications.
- Importance:
- Narrow window for optimum nutrient levels.
- Over-application → waste and possible toxicity.
- Unbalanced forage minerals → animal health issues.
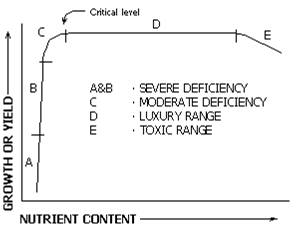
Figure 1: Schematic of plant tissue test nutrient levels and their effect on crop growth.
Optimum Nutrient Levels
- Macronutrients required in higher amounts than micronutrients.
- Vary by crop, growth stage, soil type, and climate.
Example – Alfalfa (Late Bud to Early Bloom):
(Top 15 cm tissue sample)
(Top 15 cm tissue sample)
Nutrient |
Low |
Sufficient (%) |
High |
Nitrogen |
<3.0 |
3.0 – 5.0 |
>5.0 |
Phosphorus |
<0.20 |
0.20 – 0.70 |
>0.70 |
Potassium |
<1.70 |
1.70 – 3.80 |
>3.80 |
Calcium |
<0.25 |
0.25 – 3.0 |
>3.0 |
Magnesium |
<0.20 |
0.20 – 1.0 |
>1.0 |
Sulphur |
<0.20 |
0.20 – 0.50 |
>0.50 |
Micronutrients (ppm):
Boron |
< 20 |
20 – 80 |
> 80 |
Copper |
< 5 |
5 – 30 |
> 30 |
Iron |
< 20 |
20 – 250 |
> 250 |
Manganese |
< 20 |
20 – 200 |
> 200 |
Molybdenum |
< 0.5 |
0.5 – 5.0 |
> 5.0 |
Zinc |
< 20 |
20 – 70 |
> 70 |
General Guidelines
- Cornell University: Slightly higher optimum ranges are slightly higher for example, where tissue test levels for nitrogen in alfalfa at early bloom by weight (e.g., N: 3.75–5.50%, P: 0.25–0.70%, K: 2–3.5%, S: 0.25–0.5%).
- Utah Research: Minimum thresholds for first cut:
- P: 0.26%, K: 2.0%, Ca: 1.3%, Mg: 0.25%, S: 0.26%, Zn: 21 ppm, Fe: 30 ppm, Mn: 25 ppm, Cu: 5 ppm, B: 30 ppm, Mo: 1 ppm.
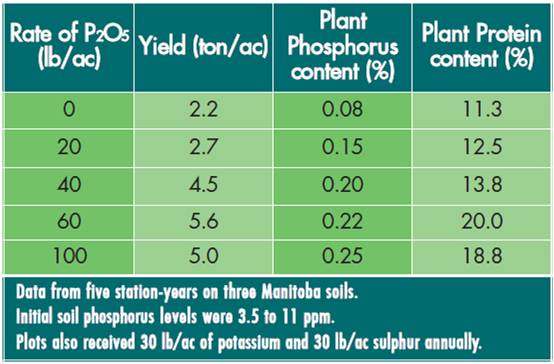
Impact on Yield and Quality – Brandon AAFC
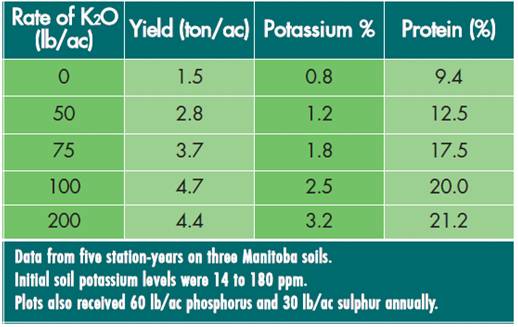
Effect of potassium application on alfalfa yield, potassium content and protein
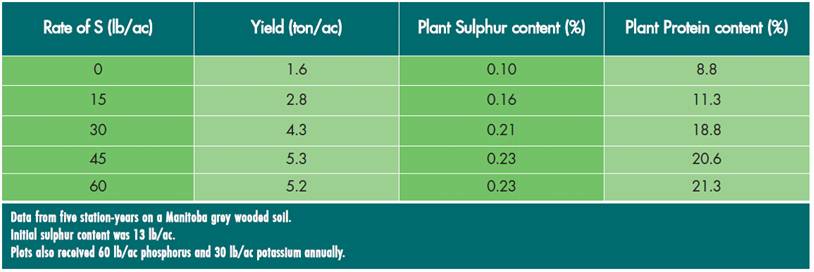
Effect of sulfur application on alfalfa yield, sulfur content and protein
Tissue Test vs. Feed Test
- Feed test:
- Useful for livestock nutrition and identifying fields needing fertility.
- Less accurate for crop fertility because samples include mixed plant parts and maturities.
- Recommendation: Use feed test as a guideline; confirm with soil or tissue test for precise fertilizer needs.
Bottom Line
- Regular soil/tissue testing ensures balanced fertility for optimum forage yield, quality, and animal health.
- Feed tests can help prioritize fields for fertility attention but should not replace soil/tissue tests.