
Life Cycle Assessment of Agriculture in Manitoba
What is Life Cycle Assessment?
Life Cycle Assessment (LCA) is the identification and evaluation of a product's major and minor environmental impacts over its entire existence, from creation to disposal, or "cradle to grave". LCA is a powerful tool for comprehensive environmental sustainability assessment of products to highlight parts of a life cycle that carry the largest environmental burdens. LCA has been used to evaluate the environmental impacts of everything from refrigerators to vehicles to solar panels. Agricultural examples include LCAs on beef, pork, and bio-ethanol, to name a few. LCA can also be used to compare the environmental impacts of two methods of producing the same product, for example, the environmental impacts of conventional vs. organic milk.
Where should we concentrate efforts to reduce greenhouse gas (GHG) emissions from agriculture? How can we improve energy efficiency in agriculture? These are two of the questions that prompted Manitoba Agriculture to embark on a LCA project to examine crop and livestock production in Manitoba.
- LCA of Wheat
- LCA of Canola
- LCA of Alfalfa-Grass Hay
- LCA Evaluation of GHG Emissions from Beef Production
- An assessment of the environmental sustainability of beef production in Canada
- A comprehensive environmental assessment of beef production and consumption in the United States
LCA of Conventional-till and Zero-till Production of Spring Wheat in Manitoba
The boundaries of Manitoba Agriculture's LCA on wheat production were drawn around processes that occur on the farm. The environmental impact of producing farm inputs was also assessed. Inputs included seed, fertilizer, pesticides and fuel. Farm operations that were evaluated included fall tillage, fertilization, seeding, pesticide application, harvesting, grain hauling, and grain drying. The LCA ended at the farm gate. Results were reported based on the production of 1,000 kg of dry wheat. Both conventional-till and zero-till wheat production systems were assessed and the study focused primarily on quantifying energy use and GHG emissions.
Model Wheat Farm
To evaluate wheat production in Manitoba it was first necessary to define the characteristics of the model farm. To represent "typical" wheat production in Manitoba a panel of Manitoba Agriculture specialists created a fictional farm located 25 km north of Brandon. Decisions about the size and type of farm machinery were based on the farm being 3,000 acres in size with one third of its acres in wheat every year.
The conventional-till wheat production system assumed most of the nitrogen (N) fertilizer was applied as anhydrous ammonia (AA) during a second tillage pass in fall. In contrast, the zero-till wheat production system did not involve any soil disturbance except what occurred with narrow openers during seeding. For the zero-till system it was assumed that all N fertilizer was applied as liquid urea ammonium nitrate (UAN) during seeding. Both systems received a total of 83.3 lbs of N, 30 lbs of phosphate (as mono-ammonium phosphate (MAP)), and 15 lbs of potash per acre. Both systems also received the same seed treatment, herbicides and fungicides, and were assumed to produce the same final yield of 45 bushels per acre. Some additional assumptions made for each production system are listed in Table 1.
Table 1. Assumptions on tillage and N fertilizer application for typical spring wheat production using conventional tillage and zero tillage techniques.
| Conventional Tillage | Zero Tillage | |
| Tillage | Two passes in fall, plus full seed-bed disturbance during seeding | None, except during seeding with narrow openers |
| N fertilizer type, % of N applied | 72% AA, 24% Urea, 4% MAP | 96% UAN, 4% MAP |
| N fertilizer timing | AA applied in fall, Urea and monoammonium phosphate applied at seeding | All fertilizer applied at seeding |
Note: The term "Conventional Tillage" is used in this study to refer to a very common tillage system in use today for wheat production in Manitoba. However, it could more accurately be described as "reduced tillage" since it involves much less soil disturbance than traditional ploughing methods, and substantial amounts of crop residue often still remain on the soil surface after the seeding operation.
Findings on Energy Use and GHG Emissions in Wheat Production
The findings of Manitoba Agriculture's LCA of wheat production are based on data that were available at the time of the study. In the future it will be possible to update and refine the model as new research results become available.
A comparison of conventional-till and zero-till spring wheat production is shown in Table 2.
Table 2. Energy required and total GHG emitted to produce 1,000 kg of spring wheat in Manitoba.
| Conventional tillage | Zero-tillage | |
| Total energy (MJ) | 3,332 | 3,471 |
| Total GHG (kg CO2e) | 309 | 242 |
Energy Use
While there was not a large difference in energy consumption between the two systems it was somewhat surprising to find that wheat produced with conventional tillage actually consumed less energy than wheat produced using zero-till techniques, despite the fact the zero-till system used less diesel fuel. Energy for fertilizer production represented about 60% of total energy consumption in each system (Figure 1). The higher energy consumption with zero-till is due to the type of N fertilizer used in each system. Anhydrous ammonia, used in the conventional-till system, requires only 73% as much energy per unit of N produced as the urea ammonium nitrate used in the zero-till system.
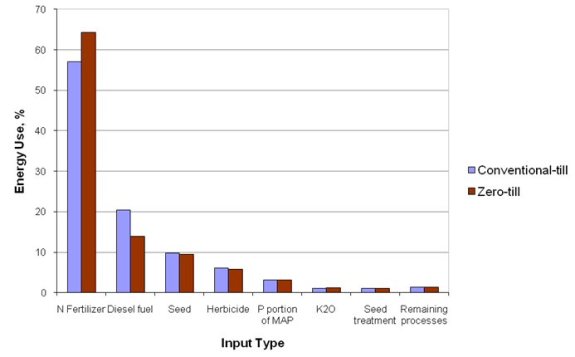 |
| Figure 1. Energy use for conventional tillage wheat production in Manitoba broken down by input type |
| Note: Remaining processes include fungicide ~ 0.95% and electricity 0.3% |
GHG Emissions
In contrast to energy use, net GHG emissions were 28% higher from wheat produced in the conventional-till system than in the zero-till system (Figure 2). The main reason for the difference in GHG emissions was the higher rate of carbon sequestration that occurred with zero-till. Using HOLOS, Agriculture and Agri-Food Canada's GHG calculator for farms, carbon sequestration rates per 1,000 kg of spring wheat were estimated to be 82.5 kg for production with conventional-till and 174.3 kg for production with zero-till. Regardless of tillage system, carbon losses from the soil due to decomposition of organic matter will eventually equal carbon additions from crop residues, and after several decades carbon sequestration rates will reach a new equilibrium. The conventional-till system is shown to be sequestering carbon because it is assumed that summerfallow was discontinued about 25 years ago and the soil is still gaining carbon to reach a new equilibrium. It is assumed that zero-tillage was adopted in the zero-till system about 10 years ago.
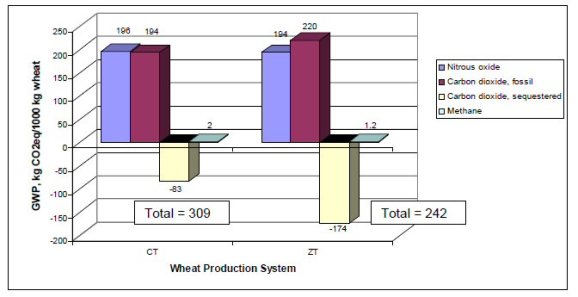 |
| Figure 2. Total Global Warming Potential (GWP) for conventional tillage and zero tillage production of 1,000 kg of spring wheat in Manitoba broken down by type of GHG source and sink. |
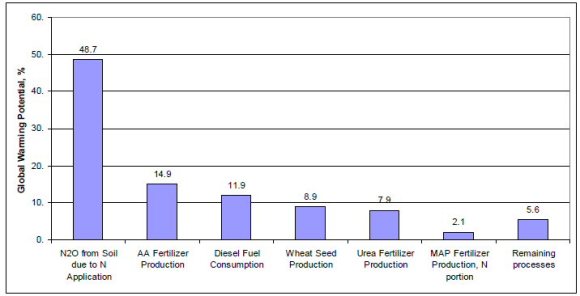
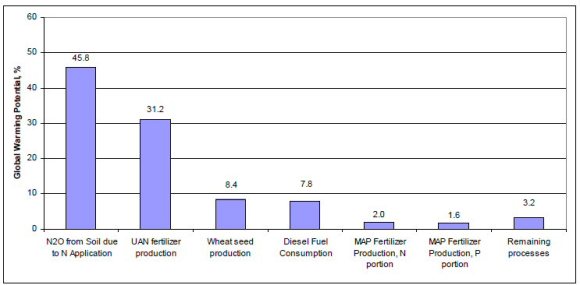
Apart from carbon sequestration the GHG emissions profiles of the two wheat production systems were quite similar, with somewhat higher carbon dioxide emissions in the zero-till system (Figure 2) because of the more energy-intense form of N fertilizer used. However, emissions from diesel fuel consumption were 30% lower in the zero-till system than in the conventional-till system. Figures 3 and 4 show breakdowns of the sources of GHG for the conventional-till and zero-till systems, respectively.
Potential for Improving the Environmental Impacts of Wheat Production
The findings of this study draw attention to the considerable proportion of energy consumption and GHG emissions attributed to N fertilizer in wheat production. Almost 50% of the GWP in the conventional-till system came from nitrous oxide (N2O) emitted from the soil as a result of N fertilizer application. Additionally, when anhydrous ammonia production, urea production, and the production of the N portion of monoammonium phosphate are added together it becomes apparent that 25% of the GWP is due to the manufacture of N fertilizer (Figure 3).
Efforts to make wheat production more energy efficient, and less GHG intense might focus on strategies to reduce reliance on synthetic N fertilizer while still maintaining yield. Improving the energy efficiency of N fertilizer manufacture will also translate into reduced energy consumption and GHG emissions in wheat production. Diesel fuel consumption by farm machinery was responsible for 12% of the GWP of wheat production in the conventional-till system (Figure 3), so improvements in farm machinery fuel efficiency will also contribute GHG emission reductions, as will reductions in the number of field operations as is achieved in the zero-till system.
The finding that the zero-till system sequestered more than twice as much CO2 as the conventional-till system is worth highlighting as an environmental benefit. Not only is zero-till production a potential option to mitigate GHG emissions, the sequestered carbon also improves soil quality in terms of water holding capacity and soil structure.
LCA of Canola Production in Manitoba
A typical method of canola production for Manitoba was evaluated for total energy use and greenhouse (GHG) emissions the results are described below.
Model Canola Farm
The farm details for the canola system were gathered by crop specialists at Manitoba Agriculture, based on a model farm located in the Sanford MB area, in the municipality of Macdonald. A one-way travel distance of approximately 15 km is required to source most farm inputs (seed, fertilizers, pesticides, etc.). The soil type is heavy clay. The farm is 3000 acres in size and every year has 1/3 of its land base in canola. Three varieties of canola are grown each year, but all are Liberty® herbicide-tolerant varieties.
Fall cultivation includes two tillage passes in the fall, (one for initial incorporation of previous crop residues with the 40 ft deep tiller (12" shovels) in September, and then one for fertilization with anhydrous ammonia (4" shovels) in mid to late October at a rate of 90 lbs N/ac. In spring no further tillage is done except during the seeding operation.
Canola production processes during the growing season include seeding, fertilization, and crop spraying. Canola is planted with an air seeder at a rate of 5 lbs/acre. The air seeder has openers every 10 inches and uses 9" shovel openers with splitters to spread the seed. The canola is Liberty® tolerant and treated with Prosper™ FL seed treatment to provide control for moderate flea beetle pressure. Granular mono-ammonium phosphate and ammonium sulphate are side-banded during the seeding operation at rates sufficient to supply an additional 23 lbs N/acre, 30 lbs P2O5/acre and 20 lbs sulphate/acre. Crop spraying includes one pass with a sprayer to apply herbicide, and another pass with a sprayer to apply fungicide later in the season. Canola receives one application of Liberty® herbicide applied at a rate of 1.35 L/acre to control weeds, with a water volume of 30 L/acre. Lance® fungicide is applied at the 0.3 kg/ac rate to control sclerotinia at the 20 to 50% bloom stage. Water volume used for Lance application is 40 L/acre.
Canola is cut with a swather and then the swaths are harvested with a combine. All straw is chopped. After harvest the land is harrowed once with heavy harrows to evenly distribute straw and chaff. The average canola yield is 36 bushels per acre. All canola is hauled to the farm yard where it is augered into aeration grain bins.
Aeration is used to bring down canola temperature and moisture to conditions for suitable storage. Approximately 75% of the canola is close to dry when harvested (~9% moisture) and so requires aeration only for cooling and not for drying. The remaining 25% of the canola is harvested damp (~13% moisture) and requires more aeration. The functional unit for the canola production system was 1000 kg of dry canola, produced during a crop cycle (1 year), at the farm gate.
Equipment manufacture was not included in this LCA.
Findings on Energy Use and GHG Emissions in Canola Production
The amount of energy required to produce one tonne (1000 kg) of dry canola in Manitoba was determined to be 4,630 MJ, and the net amount of GHG emissions as a result of producing one tonne of canola was estimated to be 548 kg CO2e (Table 3).
Table 3. Energy required and net GHG emitted to produce 1,000 kg of canola in Manitoba.
| Total Energy (MJ) | 4,630 |
| Total GHG (kg CO2e) | 548 |
Energy Use
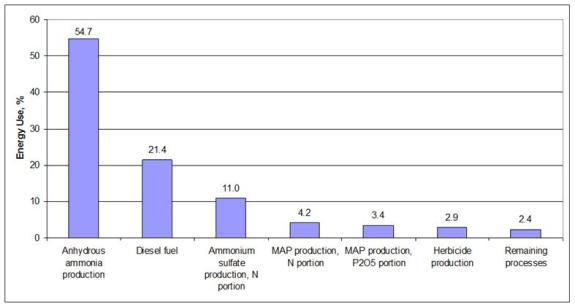
A breakdown of energy use by input type is shown in Figure 5. Production of anhydrous ammonia fertilizer contributes about 55% of the total energy requirement for canola production in Manitoba. Smaller proportions of total energy consumption come from production of the nitrogen (N) components of ammonium sulfate fertilizer (11%) and monoammonium phosphate fertilizer (MAP) (4%). When the three sources of N are combined, total energy required for production of nitrogen fertilizer equals about 70% of the total energy required for canola production. Diesel fuel production and use makes up another 21% of total energy use. Smaller contributions to energy required come from production of phosphate fertilizer (3%), production of herbicides (3%), production of canola seed (1%), and production of fungicide (1%).
GHG Emissions and Global Warming Potential
Total GHG emissions, reported as Global Warming Potential (GWP) in units of carbon dioxide equivalents (CO2eq), were dominated by N2O emissions (Figure 6). Carbon dioxide emissions were also substantial, while methane emissions were negligible. Soil carbon sequestration during production of canola was estimated to be 121 kg of CO2 per 1000 kg of canola. Soil Carbon sequestration was estimated based on the assumption that summerfallow was discontinued about 30 years ago and the soil is still gaining carbon to reach a new equilibrium. Unless new management practices are adopted, such as inclusion of perennial crops in the rotation or application of manure, the rate of soil carbon sequestration on this land will decrease in future decades as a new equilibrium of soil carbon accumulation and soil carbon break-down is established.
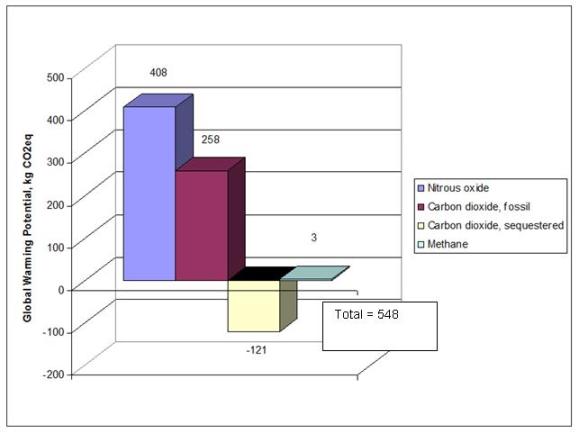 |
| Figure 6. Total GWP (kg CO2eq) for production 1,000 kg of canola in Manitoba broken down by type of GHG souce and sink. |
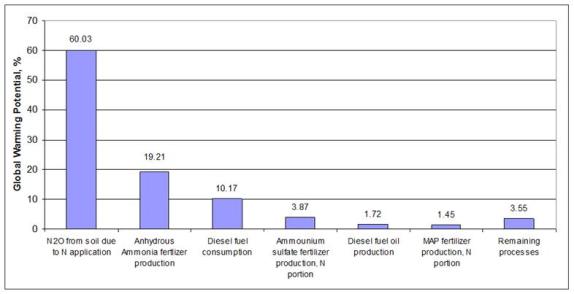
The largest contributor to GWP from canola production in Manitoba is the application of N fertilizers, which leads to emission of N2O (Figure 7). Approximately 60% of the total GWP associated with canola production was due to N application. An additional 19%, 4%, and 1% of total GWP was attributed to the manufacture of anhydrous ammonia, the N portion of ammonium sulfate, and the N portion of MAP, respectively. Collectively, soil N2O emissions resulting from N fertilization plus CO2 emissions from the manufacture of N fertilizer contributed 85% of total GWP. Diesel fuel consumption contributed 10%, and diesel fuel oil production process contributed another 2% of total GWP. Additional emissions came from phosphate fertilizer production (1%), herbicide production (1%), seed production (1%) and other processes (1%).
Potential for Improving the Environmental Impacts of Canola Production
Nitrogen fertilizer use on the modelled farm was found to be the largest contributor to both energy use and GHG emissions. Any practices that can reduce the amount of N fertilizer required to produce canola, while still maintaining yield would have good potential for reducing both energy use and GHG emissions. Reduced reliance on N fertilizer could reduce both the soil N2O emissions and the upstream CO2 emissions from N fertilizer manufacture. Improvements in the energy efficiency of fertilizer manufacture will also reduce the upstream emissions associated with canola production. Reduced fuel consumption by farm machinery also has potential to reduce energy use and GHG emissions in canola production. Reduced fuel consumption could be achieved via improved fuel efficiency of farm machinery, or reductions in the number of field operations, or a combination of both improved fuel efficiency and reduced field operations.
Prospects for enhancing soil carbon sequestration on farms that produce canola may be substantial. While this study found that soil carbon sequestration was occurring on the model farm, this will not necessarily be the case on all canola-producing farms in Manitoba.
If land management practices are static cropping systems will reach a point of equilibrium where carbon additions to the soil equal carbon losses from the soil. Strategies to increase soil carbon sequestration include reducing tillage, cultivating perennial crops to capture the full potential of the entire growing season to produce crop biomass, cover crop production, and adding manures.
For further information, Manasah Mkhabela.