
Soil Management Guide
Soil Salinity
- Background
- Conditions required for soil salinity
- Crop response to salinity
- Consult soils report for indicators of soil salinity
- Site visit
- Field symptoms
- Measuring salinity in the field
- Measuring salinity in the laboratory
- Recommendations for managing soil salinity
- Follow-up monitoring
Background
Soil salinity limits plant growth due to the presence of soluble salts in soils which hold water more tightly than the plants can extract it. As a result, many plants will exhibit symptoms of droughtiness, but the soil is often relatively moist. Salinity can develop naturally (primary salinity) or be human-induced (secondary salinity). Naturally-occurring salinity results from the long term continuous discharge of saline groundwater. Human-induced salinity is the result of human activities that have changed the local water movement patterns of an area. Soils that were previously non-saline have become saline due changes in saline groundwater discharge.
 |
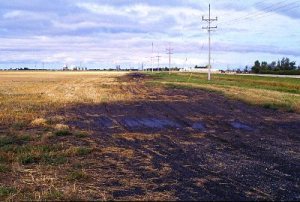 |
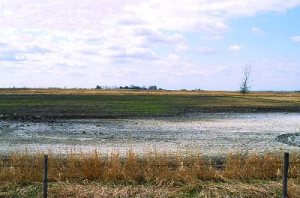
| Figures 5.1 and 5.2 Examples of saline soils and the resulting reductions in crop growth | |
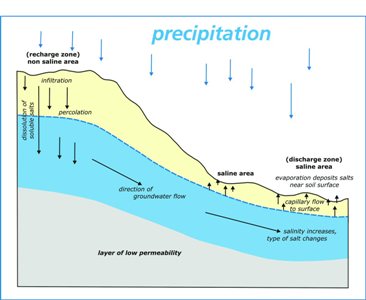 Figure 5.3 Development of soil salinity | |
In the landscape, soil salinity develops as excess water from well-drained recharge zones moves to and collects in imperfectly to poorly drained discharge zones. The buildup of excess water brings dissolved salts into the root zone of the discharge area. The concentration of these salts reduces the amount of available water, so that crops trying to grow in salt-affected areas cannot extract enough water to grow. Soil salinity can be difficult to notice from one season to the next because it is influenced by moisture conditions. In wet years, there is sufficient leaching and dissolving of salts so that they are not visible on the soil surface and some crop growth may be possible. However, the excess water received in wet years contributes to the overall salinity problem over time. In dry years, increased evaporation dries out the soil and draws salts up to the soil surface, producing white crusts of salt. In dry years, producers become more concerned with salinity because salts are highly visible and little to no crop growth occurs in the affected areas. Salt-affected soils can occur locally (only a few square feet in size, scattered over a given landscape) or regionally (large areas several acres in size). Depending on moisture conditions, these areas can increase in size or intensify in salt concentration. Overall outcomes are primarily dependent on the movement, salt content and depth of groundwater. Recharge zone – an area where water infiltration exceeds the storage capacity of the soil and moves downward to the zone of saturation (groundwater). In recharge areas, well, imperfect and poorly drained soils may have well developed A (leached) and B (clay accumulation) horizons which indicate net movement of water is downward. The surface and subsoil are usually non calcareous. Discharge zone – an area where the zone of saturation is at or near the surface and the net movement of water is towards the ground surface. Discharge may be focused in areas such as springs, weeping embankments and baseflow discharge, or it may be diffuse over larger areas of the landscape. These areas may be characterized by soils that are calcareous, imperfectly or poorly drained and have a build-up of salts.
Conditions required for soil salinity
- presence of soluble salts in subsoil, groundwater or both
- high water tables (within 6 feet (1.8 metres) of the soil surface) that can result in soluble salts moving into the root zone of the soil through the upward movement of water (i.e. capillary rise, wicking). Capillary rise increases as the texture of the soil becomes finer.
Table 5.1 Estimated capillary rise of water above table in soils (Handbook of Drainage Principles, OMAF, Publication 73)
| Soil Type | Capillary Rise |
| Very coarse sand (VCoS) | 0.8" (2.0 cm) |
| Coarse sand (CoS) | 1.6" (4.1 cm) |
| Medium sand (S) | 3.2" (8.1 cm) |
| Fine sand (FS) | 6.8" (17.3 cm) |
| Very fine sand (VFS) | 16.0" (40.6 cm) |
| Silt (Si) | 40.0" (101.6 cm) |
| Clay (C) | >40.0" (>101.6 cm) |
Salinity can occur in several different forms. The most common type of salinity is due to any type of salt present in excess in the soil, limiting the availability of water to plants. This results in high electrical conductivities. Electrical Conductivity (EC) – a measure of soluble salts within the soil. As the concentration of soluble salts increases, the EC of the soil extract increases. EC is expressed in dS/m, mS/cm, or mmho/cm (all equal). Electrical conductivity is directly related to the total dissolved solids in the soil. Total Dissolved Solids (TDS) – a measure of soluble salt content in water extracted from the soil sample, expressed in mg/L. TDS = 0.7 X 1000 X EC or EC = 1.4 X 0.001 X TDS (assumes bulk density of 1.1 g/cm3, saturated moisture content of 40% by weight and soil depth of 0-12”) Another form of salinity occurs if sodium salts are the dominant type of salts present. A relatively small amount of sodium salts can negatively affect soil structure and create a sodic soil condition but may not necessarily have high electrical conductivities. Producers often refer to these conditions as “alkali”, “gumbo”, etc.
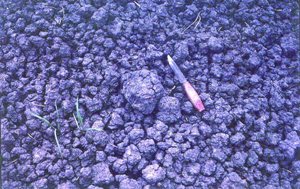 Figure 5.4 Clods from a sodic soil |
The concentration of sodium relative to calcium and magnesium in the soil is called the sodium adsorption ratio (SAR). SAR is a measure of soil sodicity. Sodium Adsorption Ratio (SAR) – a measure of the ratio of sodium (Na) to calcium (Ca) and magnesium (Mg) in a soil water extract, calculated as: SAR = [Na+]/[[Ca++ + Mg++]/2]0.5 where cation concentrations units are mmol(+)/L. Soil water extracts with SAR values >13 are indicative of a soil with a sodium problem. Even at SAR values >8, there are instances when relatively high concentrations of Na relative to Ca and Mg results in dispersion of clay particles, soil structural breakdown, and soil pore blockage which reduces infiltration rates and increases erosion potential. |
Table 5.2 Diagnosis of non-saline and salt-affected soils
| Crop | Soil Condition | Field Observations | |
| Non-saline | Pulses and vegetable crops | EC <2* SAR <13 | Normal crop growth |
| All other crops | EC <4 SAR <13 | ||
| Saline | Pulses and vegetable crops | EC >2 SAR <13 | Salt crystals at or near soil surface when dry; little or no plant growth |
| All other crops | EC >4 SAR <13 | ||
| Sodic | All crops | EC <4 SAR >13 | Shiny black when wet; dull grey, hard and cracked when dry; little or no plant growth; pH may be >8.6 |
| Saline-sodic | All crops | EC >4 SAR >13 | Any combination of the above features may be present |
*dS/m = mS/cm = mmho/cm The above values should be used as a guide for determining the presence and intensity of salinity in soil. As EC or SAR values approach these critical values, impacts on crop performance may occur. The effects of soil salinity are affected somewhat by soil texture, organic matter content, soil moisture, etc.
Crop response to salinity
Some crops are more sensitive to salinity than others. Crops such as pulses, row crops and special crops are particularly sensitive to salinity (Table 5.3). The salt tolerance of some crops changes with growth stages (Table 5.4). Sensitive crops may exhibit negative effects of salinity at levels <4 dS/m. An EC of 4 is a general salinity rating for traditional annual crops (wheat, canola) which are not significantly affected by soil salinity levels below 4 dS/m. Other rating systems (refer to Manual for Describing Soils in the Field) evaluate salinity with greater detail using the following classes:
- Nonsaline (0-2 dS/m)
- Slightly saline (2-4 dS/m)
- Weakly saline (4-8 dS/m)
- Moderately saline (8-15 dS/m)
- Strongly saline (>15 dS/m)
Table 5.3 Relative salt tolerance of Manitoba crops (adapted from McKenzie, 1988)
| EC Tolerance* (dS/m) | Field Crops | Forages | Vegetables | Trees/shrubs |
| High (16) | Tall wheatgrass Russian wildrye Slender wheatgrass | Sea buckthorn Silver buffalo-berry | ||
| Moderate (8) | 6-row barley 2-row barley Fall rye Winter wheat Spring wheat Oats Flax Canola | Birdsfoot trefoil Sweetclover Alfalfa Bromegrass Crested wheatgrass Intermediate wheatgrass Meadow fescue Reed canarygrass | Garden beets Asparagus Spinach Tomatoes Broccoli Cabbage | Russian olive Poplar Apple |
| Low (4) | Sunflowers Soybeans Corn Peas Field beans | Timothy White Dutch clover Alsike clover Red clover | Potatoes Carrots Onions Strawberries Raspberries | Common lilac Manitoba maple Colorado blue spruce Cottonwood Birch |
*Crops within a box are ranked from top to bottom as most to least tolerant
Table 5.4 Salt tolerance at two stages of growth (Soils '84)
| Crop | Growth Stage | |
| Germination | Established | |
| Barley | Good | Good |
| Fall rye | Good | Fair |
| Wheat | Fair | Fair |
| Alfalfa | Poor | Fair |
| Corn | Fair | Poor |
| Field beans | Very poor | Very poor |
Consult soils report for indicators of soil salinity
Using detailed soils information (if available), look for indicators of salinity:
xxxx = non-saline (0-4 dS/m)* xxxs = weakly saline (4-8 dS/m) xxxt = moderately saline (8-15 dS/m) xxxu = strongly saline (>15 dS/m) Example: BWO/xcxx = Barwood, 2-5% slopes, non-saline BWO/xcxs = Barwood, 2-5% slopes, weakly saline |
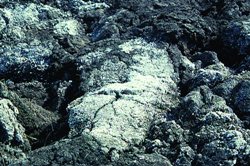 Figure 5.5 Topsoil with "t" salinity (xxxt) = 13 dS/m |
Site visit
Salinity tends to be a localized problem such that a site visit is recommended regardless of the availability of detailed soils information.
Field symptoms
Check for poor crop growth, light gray or white colours on soil surface, areas that take longer to dry and growth of salt-tolerant weeds (foxtail barley, kochia, Russian thistle, etc.).
Measuring salinity in the field
- Determine whether or not the problem is salinity by soil sampling both affected and unaffected areas. See Table 5.2 to compare soil test data with field observations. Composite soil sampling may not provide an accurate measurement of the overall salinity level of a field. To assess a suspicious area of a field for salinity, take soil samples to 2 feet (0.6 metres) from the affected area and an adjacent non-affected area. If you wish to map an entire field for its salinity status, there are indirect measurements using specialized equipment that can be used.
- Determine the source of salinity. Dig a pit in the soil of both the affected and unaffected areas, check for salt particles and check for carbonates using dilute hydrochloric acid (HCl) – see Figure 5.6. Since soluble salts are more mobile than carbonates, this can be used to determine the net direction of water movement.
- Install observation wells and piezometers to identify recharge and discharge areas.
|
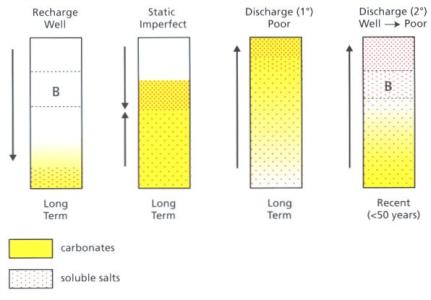
Figure 5.6 Diagnosing soil salinity using visual soil properties |
The first profile represents a typical well-drained, non-saline soil profile in a recharge area. Net movement of water is downward through the profile, with the development of a B horizon verifying this process. Carbonates are found only in the parent material (C horizon); salts are either absent or found further down the profile than the carbonates. The second profile represents imperfectly drained soils found in lower areas of the landscape where the net movement of water is relatively static. Salts and carbonates are found approximately at the same depth, which is below the soil surface but closer to the surface than in the well-drained scenario. The third profile represents a saline soil as the result of primary (1°) salinity. The net upward movement of water in poorly drained, low-lying, groundwater discharge areas produces the highest concentration of salts and carbonates at or near the soil surface. The fourth profile represents a saline soil that has recently become saline through the reversal in groundwater movement from net downward to net upward. Previously non-saline, like those conditions represented in the first box, changes in management have raised the water table and transported salts into the root zone. The presence of a B horizon and salts near the soil surface, coupled with the absence of near-surface carbonates, indicates this is the result of secondary (2°) salinity. |
Salinity can be measured indirectly using inductive electromagnetic (EM38) meters. These meters measure the apparent conductivity of the ground in mS/m in the 0 to 4 feet (0 to 120 centimetres) depth in the vertical mode and the 0 to 2 feet (0 to 60 centimetres) depth in the horizontal mode. Measuring a 4 foot (120 centimetre) depth of soil with uniform salinity should result in readings from the vertical mode twice as large as readings in the horizontal mode. Deviations from this ratio indicate salts are concentrated either at the 0 to 2 feet (0 to 60 centimetres) depth or the 2 to 4 feet (60 to 120 centimetres) depth. Because the EC values obtained from the EM38 are affected by soil texture, soil moisture and soil temperature, calibration of these values with EC values from saturated pastes is required for each salinity investigation site (McKenzie, 1988).
Table 5.5 Correlation comparison of EM38 data from field investigations on soybean performance (September, 2002)
| Laboratory Analysis | In-Field Measurement | |||
| Soil Texture | Soybean Performance | Depth (ft) | Laboratory EC (dS/m) | EM38 Reading (horizontal / vertical) |
| Clay Loam | Good | 0-2 0-4 | 0.7 1.4 | 80 100 |
| Clay Loam | Marginal | 0-2 0-4 | 1.0 4.7 | 110 150 |
| Clay Loam | Poor (saline area) | 0-2 0-4 | 3.3 10.1 | 170 230 |
| Clay Loam | Poor (wet area) | 0-2 0-4 | 1.7 9.3 | 100 115 |
| Heavy Clay | Good | 0-2 0-4 | 3.9 6.6 | 230 240 |
| Heavy Clay | Marginal | 0-2 0-4 | 4.9 5.7 | 270 270 |
Based on the data in Table 5.5, one can conclude:
- salinity is increasing with depth in most cases
- comparisons of absolute EM readings between soil textures are not appropriate because other factors affect the EM readings (eg, 230 in the clay loam is saline (10.1 dS/m) and 230 in heavy clay is non-saline (3.9 dS/m)).
EM readings allow for relative comparisons within a field of the same soil texture at a given point in time. Revisiting the site requires re-calibration of the equipment to account for changing moisture and temperature conditions. If calibration is not done, changing readings may not reflect a change in salinity, but rather changes in moisture.
Another tool for measuring salinity in the field is the VERIS meter. Similar in operation to an EM38, the VERIS meter can be pulled behind a truck and driven across an entire field. Data loggers and GPS characterize changes in salinity over the landscape. Soil samples must still be analyzed for equipment calibration and for data comparison with other fields and future monitoring.
Measuring salinity in the laboratory
When sending soil samples away for laboratory analyses, request the following information:
pH, EC, SAR, CEC and exchangeable cations (Ca, Mg, Na).
- pH > 8.6 indicates a sodic condition
- EC - increasing EC values indicate increasing salinity. EC values < 2 are considered non-saline. Sensitive crops may exhibit negative effects when EC values are > 4
(NOTE: Most commercial soil testing laboratories use a 1:1 soil:water mixture to analyze for electrical conductivity. Although faster and less expensive to conduct than the saturated soil paste method, the 1:1 method produces EC values approximately 1/2 that of the saturated paste method, depending on soil texture. Multiply EC values from 1:1 method by 2 to approximate EC values from saturated paste).
- SAR > 13 indicates sodic soil
- Ratio of Ca to Na should be 10:1 or greater; ratios less than 10:1 mean sodium may begin to cause soil structural problems
Recommendations for managing soil salinity
“The only real reclamation procedure for saline soils is to drain the excess water off the bottom and pour fresh water on the top to flush the salts out and away.” Les Henry, 1990
There are no quick or easy solutions to soil salinity. Saline soils can only be reclaimed by rinsing the salts down and out of the root zone. Preventing capillary rise involves adopting water management practices which improve drainage, lower the water table and promote the downward movement of salts in a saline soil.
Primary salinity: Saline soils due to primary salinity often have high EC values. These soils are not suited to crop production. The best course of action for primary salinity is to leave the affected area in its natural state. If the land has been tilled, salt-tolerant vegetation should be established. Secondary salinity: Saline soils due to secondary salinity may have lower EC values and may be improved with management. In order to optimize production in saline, discharge areas, water must be utilized in the adjacent, non-saline recharge areas (Table 5.6). This will decrease the movement of excess water from recharge areas to discharge areas.
Table 5.6 Management options for secondary salinity
| Control Types | Recharge Areas | Discharge Areas |
| Vegetative |
|
|
| Mechanical |
|
|
The following are additional recommendations for managing secondary salinity:
- Eliminate summerfallow – this reduces evaporation which draws water and salts to the soil surface.
- Improve drainage to lower the water table and minimize the upward movement of salts.
- Crops that use large amounts of soil water (such as alfalfa, perennial grasses, corn, sunflowers, winter wheat) should be planted in recharge areas – this reduces the amount of excess water that percolates through the soil and prevents the water table from rising in discharge areas.
- Select salt tolerant crops to grow in discharge areas in order to reduce evaporation and maximize soil water use. Since crops will not root into the water table (saturated soil), drainage may be required for crops to establish.
- Seed shallow and early when soils are moist and most favourable for germination.
- Use recommended fertilizers according to soil test information. There are no quick chemical fixes to cure soil salinity.
- Use manure and crop residues to provide additional organic matter to the soil. Although increased organic matter does not cure salinity, it reduces evaporation, improves water infiltration, water holding capacity and tilth of the soil. Apply 20 to 30 tons/acre (45 to 67 tonnes/hectare) of solid manure once every three to four years to saline areas.
- Avoid deep tillage on saline soils because it will bring salts up to the soil surface. Zero tillage should be considered for strongly saline soils. For sodic soils, deep tillage may be beneficial to break up the hardpan and improve infiltration, as well as to bring any calcium salts present in the subsoil to the surface. A field investigation should be conducted before attempting deep tillage.
- Establish forage buffer strips (at least 10 to 20 feet (3 to 6 metres) wide) immediately adjacent to municipal ditches, field drains and depressional areas to reduce the encroachment of soil salinity into the field (see the Manitoba Agriculture, Food and Rural Initiatives Field Crop Production Guide).
Forages are usually high water users and tend to be more salt tolerant than annual crops. Recommended forage mixture for saline soils (see the Manitoba Agriculture, Food and Rural Initiatives Field Crop Production Guide):
A. Hay mixture:
- 5 lb/ac (5.6 kg/ha) tall wheatgrass
- 5 lb/ac (5.6 kg/ha) slender wheatgrass
- 3 lb/ac (3.4 kg/ha) alfalfa
- 3 lb/ac (3.4 kg/ha) sweetclover
B. Hay mixture:
- 5 lb/ac (5.6 kg/ha) tall fescue
- 3 lb/ac (3.4 kg/ha) alfalfa
- 3 lb/ac (3.4 kg/ha) sweetclover
C. Pasture mixture:
- 4 lb/ac (4.5 kg/ha) creeping foxtail
- 2 lb/ac (2.2 kg/ha) alfalfa
- 2 lb/ac (2.2 kg/ha) birdsfoot trefoil
- 2 lb/ac (2.2 kg/ha) sweetclover
- 2 lb/ac (2.2 kg/ha) slender wheatgrass
D. Pasture mixture:
- 4 lb/ac (4.5 kg/ha) tall fescue
- 2 lb/ac (2.2 kg/ha) sweetclover
- 2 lb/ac (2.2 kg/ha) slender wheatgrass
- 2 lb/ac (2.2 kg/ha) creeping foxtail
- 1 lb/ac (1.1 kg/ha) alfalfa
- 1 lb/ac (1.1 kg/ha) birdsfoot trefoil
Follow-up monitoring
Keep annual records of crop yields and growing season precipitation. Using GPS technology, establish benchmark sites for repeated soil testing to monitor changes in soil salinity. If inspection wells or piezometers are installed, monitor water table levels throughout the growing season to determine if water tables are being lowered. If salinity levels do not decrease, then other management strategies may need to be considered.