
Soil Survey
Introduction
Soil is essential to human survival. We rely on it for the production of food, fibre, timber and energy crops. Together with climate, the soil determines which crops can be grown, where, and how much they will yield. In addition to supporting our agricultural needs, we rely on the soil to regulate the flow of rainwater and to act as a filter for drinking water. With such a tremendously important role, it is imperative that we manage our soils for their long-term productivity, sustainability and health.
The first step in sustainable soil management is ensuring that the soil will support the land use activity. For example, only the better agricultural soils in Manitoba will support grain and vegetable production, while more marginal agricultural soils will support forage and pasture-based production. For this reason, agricultural development should only occur in areas where the soil resource will support the agricultural activity. The only way to do this is to understand the soil resource that is available. Soil survey information is the key to understanding the soil resource.
Soil survey is an inventory of the properties of the soil (such as texture, internal drainage, parent material, depth to groundwater, topography, degree of erosion, stoniness, pH, and salinity) and their spatial distribution over a landscape. Soils are grouped into similar types and their boundaries are delineated on a map. Each soil type has a unique set of physical, chemical and mineralogical characteristics and has similar reactions to use and management. The information assembled in a soil survey can be used to predict or estimate the potentials and limitations of the soils' behaviour under different uses. As such, soil surveys can be used to plan the development of new lands or to evaluate the conversion of land to new uses. Soil surveys also provide insight into the kind and intensity of land management that will be needed.
History and Use of Soil Surveys in Manitoba
Reconnaissance, or small-scale, soil surveys were started in 1926 in Manitoba as the first step in the development of a basic program of soil research, education, conservation and use for the province. The first reconnaissance soil survey for Manitoba was published in 1940 for the south western area. It was at a small-scale of 1:126,000 or ½ inch to 1 mile. Although reconnaissance soil surveys have improved with aerial photography and interpretation since the 1940s, these maps are still based on only a small number of site investigations per section of land (approximately 6 inspections per 640 acres) and the soil map units identify only the dominant soil groups. The first large-scale, or detailed, soil survey in Manitoba was published in 1972 for the Portage la Prairie area at a scale of 1:20,000. Detailed soil surveys identify more of the variation in soil types across smaller landscapes. Detailed soil survey maps are much more accurate and reliable for making decisions at the farm-level. They are created from much more intensive site investigations ranging from 16 to 30 per section of land.
The recent intensification of agriculture, coupled with serious water quality issues throughout North America, has increased the public's concern about agriculture's management of chemicals, fertilizers and livestock manure. In response to the public’s concern, there are many new initiatives being developed in Manitoba that use soil survey information to direct on-farm management practices. These activities include:
- Environmental Farm Planning
- Manure Management Planning
- Nutrient Management Planning
- Precision Farming
- Watershed Management Planning
- Land Use Planning
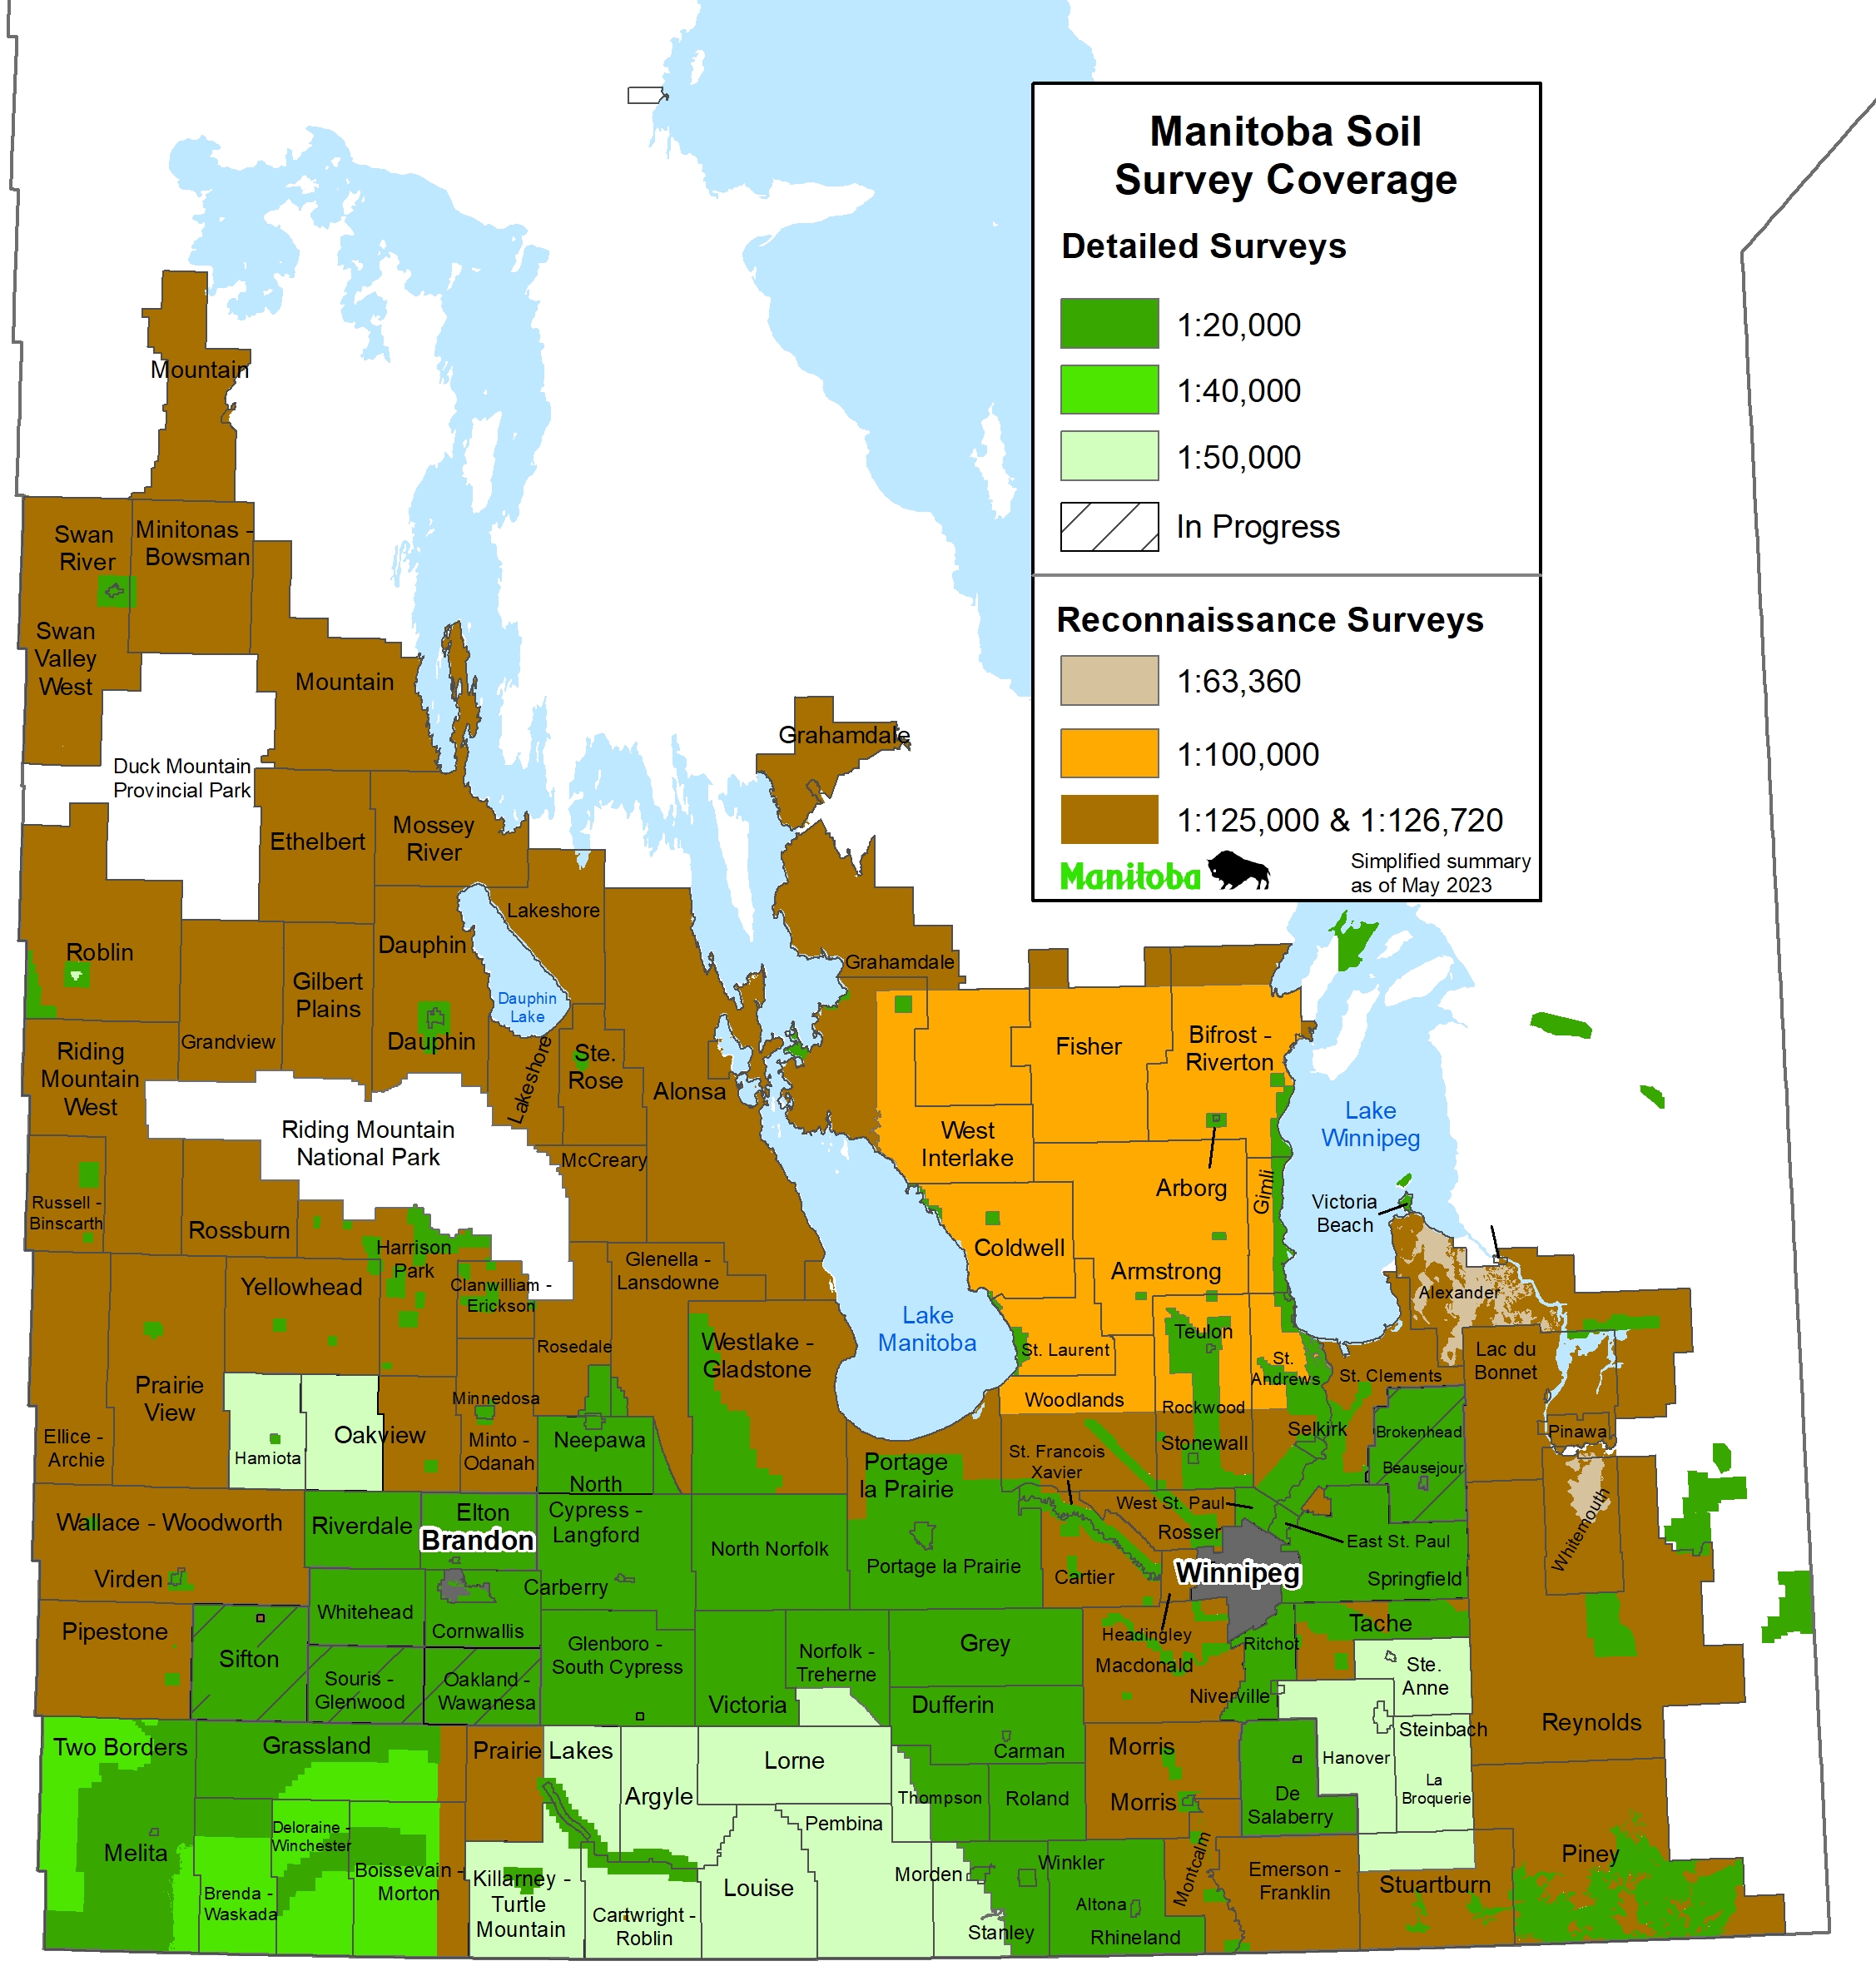
The success of many of these activities will depend on the availability of reliable, detailed soil survey information upon which the on-farm decisions are made. Unfortunately, currently only about 30% of agro-Manitoba has detailed soil survey. Essentially, there is virtually no detailed soil survey information for the Northwest region and very little for the Eastern-Interlake Region. Approximately 3/4 of the Central Region has detailed soil survey and approximately 1/3 of the Southwest Region. In many instances, when detailed soil survey information is not available, it is substituted with reconnaissance level information. Unfortunately, reconnaissance soil survey data is not reliable enough for making on-farm management decisions.
What are Soil Survey Reports? (Soil Management Guide)
How to Use a Soil Survey Report (Soil Management Guide)
Why is Map Scale Important? (Soil Management Guide)
What are the Limitations and Issues of a Map?
Soil survey maps are not without limitations. Although the map may say that a discrete area of land contains a certain soil type, it must be understood that the reliability of that information is a function of the map scale. All soil delineations (called polygons) contain small areas of dissimilar soils that are not identified (called inclusions). The smaller the scale of the map (or the more general the map), the more frequently this occurs. Small-scale, reconnaissance or general soil surveys give only a broad picture of the dominant types and distribution of soils that occur over relatively large areas. The landscape may actually include fairly significant areas of different soils that are not identified on the map. As such, reconnaissance soil surveys are best suited to making general comparisons of soil capabilities and limitations on a regional, national or even worldwide scale. They are not reliable for making on-farm decisions as they lack the detail necessary to describe the variation in the soil types on the farm.
In addition to the limitations of map scale, the boundaries of the soil map polygons imply there are abrupt changes in soil types within the landscape. In reality, however, soil varies continuously across the landscape. It must be recognized that, although the map lines imply abrupt changes, the soil grades from one type to the next and the lines on the map are only approximations of where these transitions occur.
The limitations of soil survey were summarized very simply by Hubert Byrd (Soil Survey Horizons) when he wrote:
"It is nature which controls the areal variability of soils, not soil scientists"
Similarly, it can be stated that it is nature which controls the areal variability of soils, not maps.
When detailed soil survey data is needed but unavailable, on-site investigations are necessary. On-farm soil survey can be designed for a specific purpose or general purpose. A specific or single purpose survey may be appropriate when there is only one, well-defined objective (such as siting a livestock operation). In this instance, only the information required to meet the single objective may need to be collected. The major advantage to a single purpose survey is decreased cost. A general-purpose survey, on the other hand, contains a wider range of information. Although more information is more costly to collect, the general-purpose soil survey may have more value over the long-term as it can be interpreted in a variety of ways and can be reused for many purposes.
Whether for a single or general purpose, soil survey begins with field inspections to a depth of approximately 1 meter and collecting information about the physical, chemical and biological properties of the soil. Differences in soil colour, texture and pH within the soil profile are then related to the surrounding landscape in order to determine soil type and predict behaviour. The reliability of the field data and its interpretation is largely dependent on the experience and ability of the surveyor. As soil survey expertise is scarce, data collection by less experienced individuals should always follow standardized procedures and should only be carried out by those who have received training in soil survey.
Soil Survey in Manitoba
Reconnaissance Soil Survey Reports
| Reconnaissance Soil Survey reports provide a systematic inventory of Manitoba's soil resource at a scale of 1:100 000, 1:126 720 and 1:125 000. A report consists of a coloured map which indicates the distribution and area of soil map units and a report which provides a general description of the surveyed area, physical features, factors affecting soil development and an evaluation of the soil's agricultural, engineering and urban uses. | 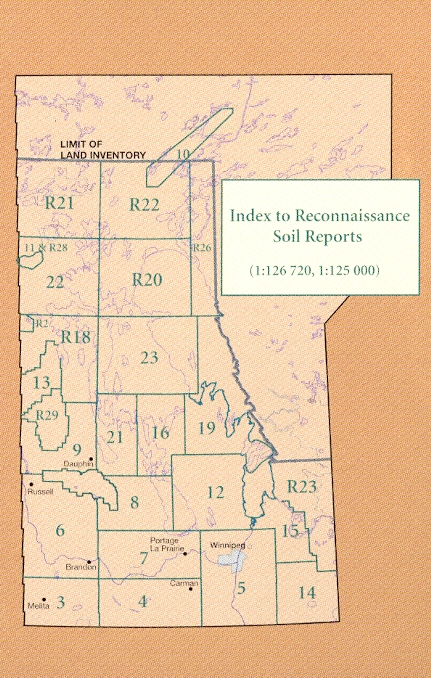 Click to enlarge |
| Report No. | Project Name | Scale | Date Printed/Status |
|---|---|---|---|
| 2 | Armstrong | 1939 | |
| 3 | South Western | 1:126 720 | 1940 |
| 4 | South Central | 1:126 720 | 1943 |
| 5 | Winnipeg-Morris | 1:126 720 | 1953 |
| 6 | Rossburn-Virden | 1:126 720 | 1956 |
| 7 | Carberry | 1:126 720 | 1957 |
| 8 | West-Lake | 1:126 720 | 1958 |
| 9 | Grandview | 1:126 720 | 1957 |
| 10 | Nelson River Basin | 1:100 000 | 1959 |
| 11 | Pasquia | 1:63 360 | 1960 |
| 12 | Fisher-Teulon | 1:100 000 | 1961 |
| 13 | Swan River1 | 1:126 720 | 1926 |
| 14 | South Eastern | 1:126 720 | 1964 |
| 15 | Lac du Bonnet | 1:126 720 | 1967 |
| 16 | Grahamdale | 1:126 720 | 1971 |
| 19 | Red Rose-Washow Bay | 1:126 720 | 1975 |
| 21 | Ste Rose du Lac | 1:125 000 | 1981 |
| 22 | The Pas | 1:125 000 | 1982 |
| 23 | Waterhen | 1:125 000 | 1985 |
| R18 | Swan Lake2 | 1:125 000 | 1996 |
| R20 | Grand Rapids2 | 1:125 000 | 1984 |
| R21 | Cormorant2 | 1:125 000 | 1975 |
| R22 | Wekusko2 | 1:125 000 | data |
| R23 | Pointe du Bois2 | 1:125 000 | data |
| R25 | Red Deer Lake3 | 1:34 860 | 1966 |
| R26 | Cross Lake-Norway House2 | 1:125 000 | data |
| R28 | Soils and Salinity Conditions in the Pasquia Lake Area | 1:50 000 | 1984 |
| R29 | Duck Mountain Forest Reserve2 | 1:125 000 | data |
1Map area with R18, Swan Lake
2Map/data available
3Report/Map available
Biophysical Land Classification Reports
| A system of inventory known as a "biophysical land classification" was used to describe various land attributes such as a soil, surficial deposits, landforms, permafrost and water in northern and eastern Manitoba. Interpretation of this basic information for environmental sensitivity, capability for wildlife, forestry, recreation etc. is possible by relating it to more dynamic features such as vegetation and wildlife populations within an overall climatic framework. | 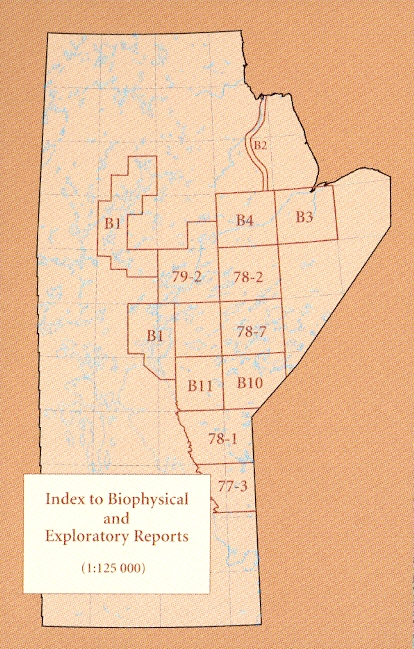 Click to enlarge |
| Report No. | Project Name | Scale | Date Printed/Status |
|---|---|---|---|
| B1 | Lake Winnipeg, Churchill and Nelson River | 1:250 000, 1:50 000 | 1973 |
| B2 | Churchill Transportation Corridor | 1:125 000 | data |
| B3 | Hayes River, 54C | 1:125 000 | 1976 |
| B4 | Kettle Rapids, 54D | 1:125 000 | 1976 |
| 77-3 | Hecla, 62P-Carroll Lake, 52M | 1:125 000 | 1977 |
| 78-1 | Bernes River, 63A-Deer Lake, 53D | 1:125 000 | 1978 |
| 78-2 | Knee Lake, 53M | 1:125 000 | 1978 |
| 78-7 | Oxford House, 53L | 1:125 000 | 1978 |
| 79-2 | Sipiwesk Lake, 63P-Split Lake, SE - 64A | 1:125 000 | 1979 |
| B10 | Island Lake, 53E | 1:125 000 | data |
| B11 | Norway House, 63H | 1:125 000 | data |
Detailed Soil Survey
Detail Soil Reports (1:20 000, 1:40 000, 1:50 000) provide detailed and comprehensive soil resource information to supplement and expand on information contained in the Reconnaissance soil survey reports. As well as basic soil information, a variety of derived and interpretive maps can be generated including Soil Suitability for Agriculture, Soil Suitability for Irrigation, Drainage, Salinity, Potential Impact of Irrigation.
The two concepts of "intensity of mapping" and "map scale" refer to different but closely related aspects of a soil survey. The Survey Intensity Level (SIL) is defined by the number of field inspections per unit area. Survey Intensity Levels range from SIL1 (very detailed) to SIL5 (exploratory in nature). Map scale is the scale of publication. In general an SIL1 relates to 1:5,000 map scale, an SIL3 relates to a 1:20,000 to 1:50,000 map scale and an SIL5 related to a 1:100,000 or smaller map scale. The provincial soil survey program places the emphasis on map scale in its program. Field inspection sites for a 1:20,000 map scale (3.2 inches to 1 mile) requires 25-30 inspection sites per section of land and a 1:50,000 map scale (1.5 inches to 1 mile) requires 16 inspections per section. A two-person crew usually maps one section per day.
The steps involved in organizing a detailed soil survey at 1:20,000 map scale are:
Preplanning
- Review all existing background information for the area to be surveyed. This includes reconnaissance and/or detailed soil reports, elevation maps, NTS maps, and aerial photos. The geological information about the surveying region should also be included. NTS maps and aerial photos can be used to assess the accessibility of each section to be surveyed. Using twin air photos viewed with stereo glasses or software like PurView delineate landform boundaries. Draft soil polygons and soil observation sites can be identified.
Group correlation
- Landscape and topography are reviewed and representative sites for field inspection and soil polygon delineation are selected. The description of the soil profile must be described by all surveyors in an accurate and consistent manner to ensure that the same soil is being classified as the same series by all surveyors.
Field surveying 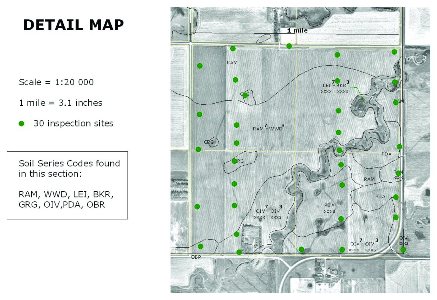
- Investigate soil variability within landforms by soil sampling to a depth of at least 3 feet (1 meter) at regular intervals along transects. (It is preferable to georeference these inspection sites using GPS technology). Inspections are conducted every 1/4 mile (400 metres) around the perimeter of a section and every 1/8 mile (200 metres) along two transects at the 1/4 mile (400 metres) and 3/4 mile (1200 metres) points of the section, for a total of 30 sites (see right). Classify soils in the field visually using standardized criteria for texture, colour, presence of carbonates, presence of mottles, and type of parent material and landscape position. This information will assist in determining what soil horizons are present, which in turn will identify the soil series and phase present in each map unit.
- Record any changes (land use, drainage improvement, etc.) between images and onsite observations. Polygons are verified on mylar based on site inspections. Field tests of soil texture and calcareous reaction with are regularly verified with reference samples. Soil samples from different horizons are collected while minimizing contaminations. Soil samples must represent all soil series observed. Any unusual findings are discussed at regular onsite meetings.
- In order to maintain a database of soil properties such as texture, pH, carbonate content and salinity throughout different areas of the province, samples are taken from daily sites for analysis. Random surface and subsurface samples should be taken to quantify these properties.
- At a 1:50000 scale approximately 2 inspection sites per section will be sampled — 2-3 horizons per site = Approximately 5 samples per section (180 samples per township) Approximately 10 samples per section (360 samples per township) at a 1:20,000 map scale.
- Lab analyses also aid soil surveyors by confirming soil texture or carbonate levels and these are in addition to the random sampling mentioned above. Soil series should also be considered when the samples are taken so that most soil series will have lab data for verification of characteristic properties.
Methods of Soil Analysis, Parts 1 and 2, and Carter (1993) can be referred for the following soil properties. Laboratory analyses of the following factors are conducted in order to verify field data for proper soil horizon classification: (Olson, 1984, p.22):
- particle size (texture) - pipette method
- bulk density
- water retention
- cation exchange capacity
- base saturation
- sodium adsorption ratio (SAR)
- organic carbon
- calcium carbonate, gypsum
- N, P, K, S, Ca, Mg, Na, Fe, Al, NO3-, CO3-2, HCO3-, Cl-, SO4-2 using atomic absorption and/or ion specific electrode analyses
- electrical conductivity (EC) from the saturated paste method
- pH (in CaCl2)
Soil polygon delineation
- Refine map units and soil boundaries from field descriptions, laboratory data and variability observations.
- Verify soil classifications by recording all pertinent data, reviewing field and laboratory data, re-examining stereo photographs and consulting with experienced pedologists.
- Draw lines to indicate the soil boundaries and include soil symbols on the air photos or base map. Write soil map unit descriptions.
- The considerations for drawing soil polygons should include the following:
- Map scale: this affects the appropriate number of soil polygons per unit area.
- Polygon size: the minimum polygon size should be appropriate for the map scale. As a general rule, the smallest soil polygon on any scale of map should be larger than 0.5 cm2, for allowing map unit symbols to be legible, unless for strongly contrasting units.
- Landscape, topography, soil drainage, soil parent materials/soil series, differentiating contrasting features such as water bodies, bushes, and forest.
- Using natural features such as water courses as polygon boundaries.
- Using updated and best representing images and other available supporting feature layers.
- Considering previous soil maps and polygon boundaries if available.
- Digitizing of fixed features such as streams or water bodies should take place while zoomed in to 1:2,000 to 1:5,000 for 1:50,000 maps and 1:1000 to 1:3,000 for 1:20,000 maps. Other resources for imagery to compare to ArcMap include: satellite imagery, 3D imagery used in tandem between ArcMap and SUMMIT, topographical elevation models and Google Earth.
- Manitoba Soil Survey Field Procedures Manual (PDF 2.17 MB)
- Manitoba Soil Survey Laboratory Procedures Manual (PDF 421 KB)
Detailed Soil Survey Maps and Reports
| Project No. | Project Name | Scale | Date Printed/Status |
|---|---|---|---|
| 17 | Portage la Prairie | 1:20 000 | 1972 |
| 18 | Morden-Winkler | 1:20 000 | 1973 |
| 20 | Boissevain-Melita | 1:20 000; 1:40 000 | 1978 |
| 29 | Winnipeg Region (D14) | 1:20 000 | 1975 |
| 30 | Brandon Region (D15) | 1:20 000 | 1976 |
| D13 | LGD Alexander-Organic Soil Study | 1:63 360 | 1975 |
| D17 | Roseau River-Organic Soil Study | 1:20 000 | 1977 |
| D19 | Pelican-Rock Lake | 1:20 000 | 1983 |
| D20 | West Portage-MacGregor | 1:20 000 | 1982 |
| D21 | Lake Minnewasta | 1:20 000 | 1978 |
| D22 | Killarney | 1:20 000 | 1979 |
| D23 | Matlock-Gimli-Riverton | 1:20 000 | 1981 |
| D24 | Glenboro | 1:20 000 | 1979 |
| D25 | Sandy Lake | 1:20 000 | 1980 |
| D26 | Brokenhead | 1:20 000 | 1979 |
| D27 | Rockwood | 1:20 000 | 1980 |
| D28 | Oak Lake | 1:20 000 | 1979 |
| D29,30 | Bird River-Lac du Bonnet | 1:20 000 | 1980 |
| D31 | Grindstone Point | 1:20 000 | 1979 |
| D32 | Paint Lake | 1:10 000 | 1980 |
| D33 | Cranberry Portage | 1:5 000 | 1980 |
| D34 | Dauphin | 1:20 000 | 1981 |
| D35 | South Riding Mountain Planning District | 1:20 000 | 1990 |
| D36 | West Interlake | 1:20 000 | 1981 |
| D37 | Swan River | 1:20 000 | 1987 |
| D38 | Hadashville Organic | 1:20 000 | 1981 |
| D40 | Falcon Lake, West Hawk, Brereton, Jessica Lake Areas | 1:20 000 | data |
| D41 | Quesnel Lake, Winnipeg River Area | 1:20 000 | data |
| D42 | Duck Mountain | 1:20 000 | 1982 |
| D43 | Spruce Woods E.L.C. | 1:40 000 | data |
| D45 | Pine Creek | 1:20 000 | 1983 |
| D46 | Arborg-Riverton | 1:20 000 | 1982 |
| D47 | Roblin | 1:20 000 | 1983 |
| D48 | Flin Flon | 1:20 000 | 1989 |
| D49 | RM's of Ste Anne, La Broquerie and part of GD Stuartburn | 1:50 000 | 1985 |
| D50 | City of Brandon | 1:20 000 | 1984 |
| D51 | Westbourne | 1:20 000 | 1985 |
| D52 | Rathwell, Treherne, Notre Dame | 1:20 000 | 1984 |
| D53 | Altona, Emerson, Gretna, Ile des Chenes, Landmark, Letellier, Rosenort, St. Jean | 1:20 000 | 1984 |
| D54 | Russell-Binscarth | 1:20 000 | 1985 |
| D55 | Ste. Rose du Lac | 1:20 000 | 1985 |
| D56 | Souris, Wawanesa, Virden | 1:20 000 | 1986 |
| D57 | Fraserwood, Inwood, Komarno | 1:20 000 | 1986 |
| D58 | Hallboro-Neepawa | 1:20 000 | 1984 |
| D59 | Beaudry Park | 1:20 000 | 1986 |
| D60 | RM's of Dufferin, Grey, Roland, Thompson and part of Stanley | 1:20 000;1:50 000 |
1988 |
| D61 | Meditation Lake, Wanipigow Lake Areas | 1:20 000 | data |
| D62 | Wanipigow Lake | 1:20 000 | data |
| D63 | Shellmouth Reservoir North | 1:20 000 | 1987 |
| D64 | South Assiniboine River | 1:20 000 | 1987 |
| D65 | Birtle, Elkhorn, Hamiota, Newdale, Rapid City, Shoal Lake, Strathclair | 1:20 000 | 1987 |
| D66 | Benito-Durbin | 1:50 000 | data |
| D67 | St. Eustache, Springstein, Perimeter Strip, Brunkild, La Salle River | 1:20 000 | 1989 |
| D68 | Spruce Point Mine | 1:10 000 | 1985 |
| D69 | Snow Lake | 1:20 000 | 1985 |
| D70 | Lorne RM | 1:50 000 | 1987 |
| D71 | Whitemouth Peatland | 1:50 000 | 1987 |
| D73 | Victoria Beach-Elk Island | 1:20 000 | 1990 |
| D74 | South Norfolk | 1:20 000;1:50 000 |
1987 |
| D75 | Victoria RM | 1:20 000 | 1989 |
| D76 | Rhineland RM | 1:20 000 | 1991 |
| D77 | Pembina RM | 1:50 000 | 1993 |
| D80 | Norfolk RM | 1:20 000 | 1991 |
| D81 | Plum Lakes Project | 1:20 000 | 1991 |
| D82 | Hanover RM | 1:50 000 | 1993 |
| D83 | Louise RM | 1:50 000 | 1998 |
| D84 | Argyle RM | 1:50 000 | 1997 |
| D85 | North Cypress RM | 1:20 000 | 1999 |
| D86 | Strathcona RM | 1:50 000 | 1999 |
| D88 | Springfield | 1:20 000 | 2011 |
| D89 | Ritchot | 1:20 000 | 2011 |
| D90 | Killarney-Turtle Mountain | 1:50 000 | 2011 |
| D91 | Blanshard | 1:50 000 | 2011 |
| D92 | Roblin | 1:50 000 | 2013 |
| D93 | Hamiota | 1:50 000 | 2013 |
D94 D95 |
1:20 000 1:20 000 |
2020 2014 | |
| D96 | Elton | 1:20 000 | 2020 |
| D97 | Cornwallis | 1:20 000 | 2017 |
| D98 | Riverdale | 1:20 000 | 2022 |
D99 D100 |
1:20 000 1:20 000 |
2020 2026 |
Several intensive soil surveys (1:5 000) have been carried out on smaller sites with the purpose of describing the soil conditions in sufficient detail to assist in planning and managing the soil resources in support of specific research purposes.
| Report No. | Special Soil Resource Products |
|---|---|
| 93-1 | Soils of the Carman Research Station N½ Sec23-Tp6-Rge5W 1:5 000 map and report |
| 94-1 | Minor Element Content of Agricultural Soils in Manitoba |
| 94-2 | Geomorphology and Soil Quality of the Twin Watershed Area and Project |
| 94-3 | Soils of the Manitoba Zero Tillage Research Association Research Farm Sec31-Tp12-Rge18W 1:5 000 map and report |
| 95-1 | Soils of the Manitoba Crop Diversification Centre S½ Sec8-Tp11-Rge14W 1:5 000 map and report |
| 96-1 | Soils of the Roblin Effluent Irrigation Site NE¼ 20-Tp25-Rge28W 1:5 000 map and report |
| 96-3 | Water Erosion Studies in Manitoba - A Status Assessment |
| 97-1 | Soils of the S½ of N½ Sec3-Tp3-Rge5W Morden MB |
| 97-2 | Unified Soil Classification System for Engineering Applications 1:2 000 000 map and report |
| 99-1 | Soils of SE32-14-25W, Miniota Precision Agriculture Research Site 1:5 000 |
| 99-2 | Soils of the Brandon Research Centre |
| 99-3 | Soils of 32-09-19W, Research Plot Sites, Brandon Research Centre |
| 5242/B | Soil Landscape Map of Manitoba 1:1 000 000 map and legend |
| 5257/B | Wind Erosion Risk Map of Manitoba 1:1 000 000 map and legend |
| 5259/B | Water Erosion Risk Map of Manitoba 1:1 000 000 map and legend |
| 5261/B | Soil Salinity Map of Manitoba 1:1 000 000 map and legend |
| The Soils of Manitoba | |
| Soil Survey of the Morden Experimental Farm, Morden | |
| The Soils of Deep Lake Study Area | |
| Soil Map of the Onanole Study Area - Portions of Tp 19 Rges 18 and 19W | |
| Glenlea Research Station - Lots 2 to 9 inc - Parish of St Norbert Tp 8 Rge 3E |
The Description of Soil Series in Manitoba (PDF 1.33 MB)
Why are Detailed Soil Survey Reports Required for In-Field Assessments? (Soil Management Guide)
Options for data collection when detailed soil survey information is unavailable (Soil Management Guide)
The Geospatial Environment
Soil surveys have been published for all of Agro-Manitoba and for certain areas across Central and Northern Manitoba. Data from these surveys comprise the most detailed soil inventory information in the SoilAID (Soil Agricultural Interpretations Database) and SoilSMUF (Soil Map Unit File) GIS files which are available for download on the MLI (Manitoba Land Initiative) website. These files are the source of soil information on Agri-Maps, a web-based map viewing application. (Note: No registration is required to access MLI, users need to agree to the “terms and conditions”. Registration is not required for Agri-Maps.)
The significant characteristics of detailed and reconnaissance soil surveys are as follows:
- SCALE: For detailed soil survey, scale ranges from 1:20,000 to 1:50,000. For reconnaissance soil survey, scale ranges from 1:125,000 to 1:126,720. Scale can vary within one Rural Municipality (RM), depending on different surveys conducted at different times and different scales in different portions of an RM. Note: Some smaller project areas were surveyed at a scale of 1:5,000; however, not all of these files have been digitized to GIS files.
- COVERAGE: Coverage consists of 119 individual RMs mainly of the significant agricultural areas. For specific coverage, see the SoilAID and SoilSMUF.
- SYMBOLIZATION: Within survey projects symbolization and legend is consistent and correlated between map sheets. Map symbols and the associated information are located in the SoilAID Description and SoilSMUF Description files.
- CORRELATION: Some map edges may not have been matched to computer tolerances and therefore inconsistencies may exist between RMs in terms of symbolization. This may result in an imperfect correlation when seaming data across RM boundaries.
- ATTRIBUTES: For each polygon, the shapefile (.shp) attribute table defines up to three soils/non-soils (Field = MAPUNITNOM), in addition to an estimate of the proportion of each soil/non-soil within the polygon (Fields = EXTENT1, EXTENT2, EXTENT3). Soil association names in Reconnaissance GIS files have been translated to soil series names in the MAPUNITNOM Field.
Dataset descriptions
The following data categories are used as references for delineating polygons within the SoilAID and SoilSMUF files.
- Administrative Boundaries (RM, Section Files, Urban Areas)
- Hydrological Data
- Transportation Network Data
- Cadastral Data
Each SoilAID and SoilSMUF file contains a metadata file. An example is the metadata for the RM of Albert.
For further information, contact your Manitoba Agriculture Office.