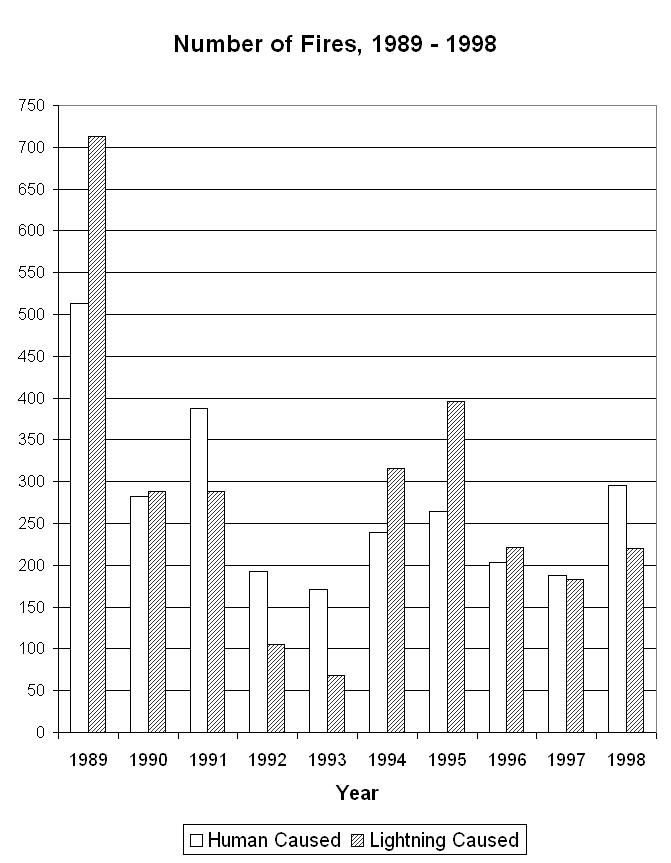
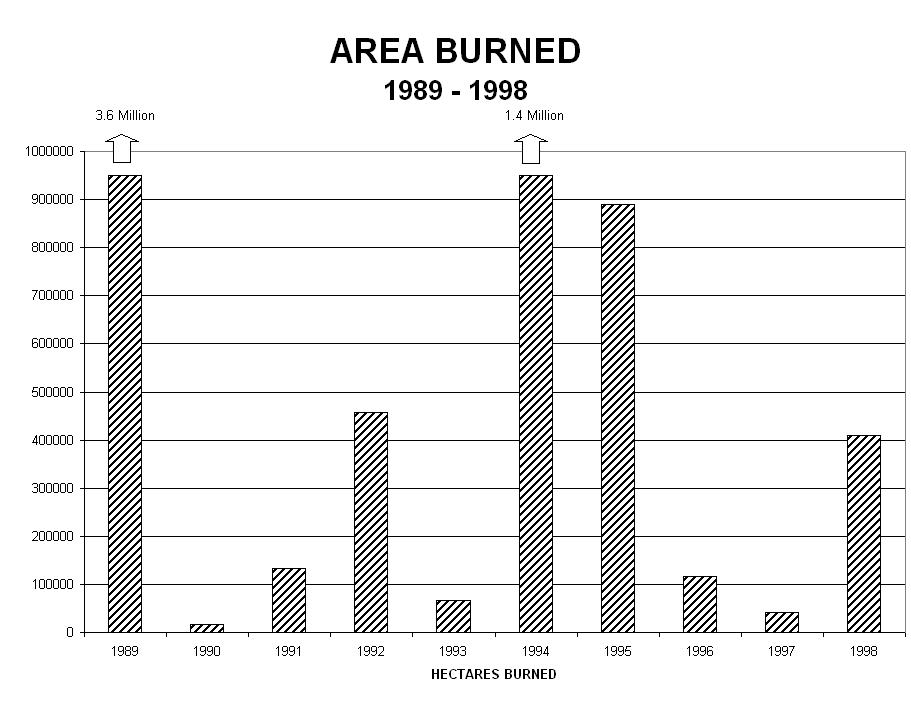
TABLE RO. 20 (page 38)

"the following excerpt is taken from the 1998 - 1999 Annual Report for the Department of Natural Resources, pages 36 -41 "
Fire Program
The 1998 fire season began with first fires reported on April 13. Over-winter precipitation was among lightest on record and, with above-normal temperatures, all indicators pointed to an above-normal fire season. By end of April, fire activity had increased dramatically: 108 fires burning an estimated 6595 ha. Air tankers came into use as ice left the lakes with their first mission (April 19, on a fire near Falcon Lake) at least three weeks earlier than usual. A return to seasonal temperatures in early May, and scattered showers, decreased fire starts and potential for large fires. By end of May, 159 fires had burned 6967 ha.
The last week in May and the start of June saw well below-normal temperatures with killing frosts. The first lightning fire was recorded on June 10. Rising temperatures in early June brought threat of lightning fires, but no storms were reported and only 3 lightning fires were recorded by June 25. Heavy rains in the week of June 15 dramatically decreased starts. A return to seasonal temperatures and lightning storms in the last few days of June and first two weeks of July increased fire activity and a corresponding acquisition of additional short-term helicopters.
Smoke conditions and a concern for respiratory conditions resulted in the Chief and medical personnel evacuating 97 people from Red Sucker Lake in the second week of July. Above-normal temperatures in late July and early August resulted in high-to-extreme alert levels and a requirement to man-up significantly. A fire near Leaf Rapids required major suppression effort. Two additional waterbombers were acquired from Northwest Territories. Timely rains occurred in mid-August, but, from mid-August until September 18, above-normal temperatures and much below-normal precipitation extended the fire season. By season's end, 516 fires had consumed 408,916.6 ha.
Seasonal resources available to the Program were seven CL-215 water bombers, three Bird Dog aircraft, four medium and one light contract helicopters, three Otters, eight mobile warehouses, initial attack crews strategically placed at 30 bases, fire rangers and detection personnel. The Province maintains 3 fire overhead teams, 3 burn teams, fire investigators, media specialists, and aircraft management and safety officers, drawn mainly from Natural Resource Officer staff.
Due to the quieter fire season, other fire-control agencies in Canada and the United States were assisted:
Minnesota: A CL-215 demonstration and a CL-215 group dispatch to a fire near Grand Marais.
Alberta: two CL-215 groups on several occasions, fire overhead staff as cat bosses and division bosses to the High Level fires, burn team with equipment and a burn specialist on two occasions, 10 power pumping units, and initial attack crew personnel to Slave Lake area.
Saskatchewan: 3 contract helicopters, 2 helitorches, volume pumping units, camping gear, a CL-215 group, and on numerous occasions, CL-215 support on quick strike.
Ontario: on three occasions, CL-215 groups, two medium helicopters, 95 initial attack personnel, and quick strike with CL-215's.
Yukon: a burn team (2 personnel).
Northwest Territories: a CL-215 air tanker group.
British Columbia: 25 relay tanks.
Manitoba received CL-215 waterbomber assistance from the Northwest Territories. Cross-border quick strikes occurred between Manitoba and Ontario, and Manitoba provided quick strike into Saskatchewan.
Manitoba retired its old lightning detection network, and now depends on Environment Canada and Global Atmospherics for its lightning data. Satellite dishes and new display units were deployed at 4 locations (Winnipeg, Lac du Bonnet, Thompson, The Pas) to provide real-time lightning data.
Manitoba is converting its National Fire Information System program to a Windows NT platform, in conjunction with the Desktop Initiative, enabling integrated and automated web pages. Conversion will be completed for the 1999 fire season.
Good-quality satellite imaging from Natural Resources Canada were used to monitor large northern fires.
All permanent staff involved with fire were trained at the Division Boss level. A fire investigation course for 30 students was completed and initial attack crew bosses had training upgraded. A new publication, Safety Tips for Emergency Fire Fighters - A Guide to Personal Safety, was produced.
Two more Canadair CL-215 waterbombers were purchased from the Province of Quebec and a Cessna 310 Bird Dog aircraft was acquired. With seven CL-215 waterbombers, the Program can provide a group including two waterbombers and Bird Dog aircraft at each of the primary initial attack bases of Gimli, The Pas and Thompson, and move the seventh waterbomber to areas of high need.
The Wildfires Act, proclaimed on January 1, 1998, was in effect for 1998.
The Fire Equipment Working Group revised cache levels and embarked on a complete overhaul of the types of equipment stocked. A new Fire Equipment Standards Manual was published.
Manitoba, as chair of the Great Lakes Forest Fire Compact Prevention Committee, was heavily involved with the Prevention Institute held in Sault Ste. Marie. A Game Warden television program featured Manitoba Natural Resource Officers in their capacity as fire managers.
|
Table RO.19 12-2(g) Fire Program |
|||||
|
Expenditures by Sub-appropriation |
Actual 1998/99 $ |
Estimate 1998/99 |
Variance Over/(Under) |
Expl. No. |
|
|
|
|
FTE |
$ |
|
|
|
Total Salaries and Employee Benefits Other Expenditures |
2,777.8 7,972.5 |
60.94
|
2,910.2 8,216.9 |
(132.4) (244.4) |
|
TABLE RO. 20 (page 38) 
TABLE RO. 21 (page 39) 
TABLE RO. 22 (page 40)
| Northeast | Northwest | Western | Central | Eastern | Province | |||||||
| CAUSE | # fires | area burned (hectares) | # fires | area burned (hectares) | # fires | area burned (hectares) | # fires | area burned (hectares) | # fires | area burned (hectares) | # fires | area burned (hectares) |
| recreation | 46 | 138.9 | 7 | 7.3 | 8 | 623.1 | 2 | 51.0 | 15 | 14.8 | 78 | 835.1 |
| settlement | 7 | 14.7 | 6 | 75.0 | 8 | 317.5 | 14 | 787.5 | 10 | 6.7 | 45 | 1,201.4 |
| woods operations | 1 | 10.0 | 1 | 2.0 | 1 | 0.1 | 3 | 12.1 | ||||
| other industry | 1 | 0.1 | 3 | 100.2 | 4 | 100.3 | ||||||
| railroads | 1 | 0.1 | 14 | 201.9 | 5 | 3.8 | 20 | 205.8 | ||||
| public projects | 5 | 4.9 | 5 | 4.9 | ||||||||
| incendiary | 37 | 110.6 | 10 | 120.9 | 6 | 632.5 | 41 | 2,920.8 | 21 | 181.9 | 115 | 3,966.7 |
| miscellaneous | 3 | 4.3 | 2 | 4.2 | 1 | 12.0 | 1 | 0.5 | 8 | 30.2 | 15 | 51.2 |
| agricultural | 2 | 45.0 | 8 | 969.0 | 1 | 0.5 | 11 | 1,014.5 | ||||
| lightning | 164 | 401,206.4 | 22 | 96.2 | 5 | 10.1 | 29 | 212.1 | 220 | 401,524.8 | ||
| all causes | 259 | 401,485.0 | 62 | 505.6 | 29 | 1,732.3 | 71 | 4,738.9 | 95 | 455.0 | 516 | 408,916.8 |
TABLE RO. 23 (page 41)
| Actioned Fires | No Action Fires | Limited Action Fires | All Fires | |||||||||||||
| ZONE | # fires | % fires | area burned (hectares) | % of area burned | # fires | % fires | area burned (hectares) | % of area burned | # fires | % fires | area burned (hectares) | % of area burned | # fires | % fires | area burned (hectares) | % of area burned |
| RED | 243 | 56.5% | 5,686.0 | 15.5% | 4 | 5.4% | 1.3 | 0.0% | 2 | 16.7% | 3.0 | 0.0% | 249 | 48.3% | 5,690.3 | 1.4% |
| YELLOW | 10 | 2.3% | 74.3 | 0.2% | 10 | 1.9% | 74.3 | 0.0% | ||||||||
| GREEN | 168 | 39.1% | 30,390.4 | 82.7% | 8 | 10.8% | 172.6 | 0.0% | 6 | 50.0% | 131.2 | 1.4% | 182 | 35.3% | 30,694.2 | 7.5% |
| WHITE | 9 | 2.1% | 575.7 | 1.6% | 62 | 83.8% | 362,752.3 | 100.0% | 4 | 33.3% | 9,130.0 | 98.6% | 75 | 14.5% | 372,458.0 | 91.1% |
| ALL ZONES | 430 | 100.0% | 36,726.4 | 100.0% | 74 | 100.0% | 362,926.2 | 100.0% | 12 | 100.0% | 9,264.2 | 100.0% | 516 | 100.0% | 408,916.8 | 100.0% |