Provincial Respiratory Surveillance Report
COVID-19 and Seasonal Influenza
This report provides a current epidemiological update on the intensity and severity of COVID-19 in Manitoba. Surveillance and administrative data include laboratory, public health case and contact tracing investigations, hospitalization and mortality data. Data are presented at the provincial and regional level; and include a focussed review on the disproportional impact of COVID-19 on various populations in the province.
Epidemiology and Surveillance also continues to monitor the activity of seasonal influenza in Manitoba during this pandemic. During the 2020–2021 influenza season, routine reporting of seasonal influenza is included in this weekly report.
In this weekly respiratory surveillance report, we provide regular updates about the current activity of COVID-19 and seasonal influenza in Manitoba with overall objectives:
- To understand COVID-19 within the respiratory context;
- To present a detailed overview about COVID-19 cases and contacts; and
- To continue monitor and report on seasonal influenza during the pandemic.
Data are reported with a one-week delay for increased data accuracy, completeness and reliability. More analyses continue to be conducted and will be added to this report as available. It is published online at approximately 10:00am every Monday.
Week 33 (August 15 – August 21)
Data extracted up to 4:00 am on August 27, 2021
Next reporting date: September 6, 2021
|
||||||||||||||||||
|
|
|
||||||||||||||||
|
|
|
||||||||||||||||
|
||||||||||||||||||
|
||||||||||||||||||
|
|
|
||||||||||||||||
|
Important Notes
|
||||||||||||||||||
Cases
Figure 1. Cases of COVID-19 by Week of Public Health Report Date, Manitoba, August 16, 2020 – August 21, 2021
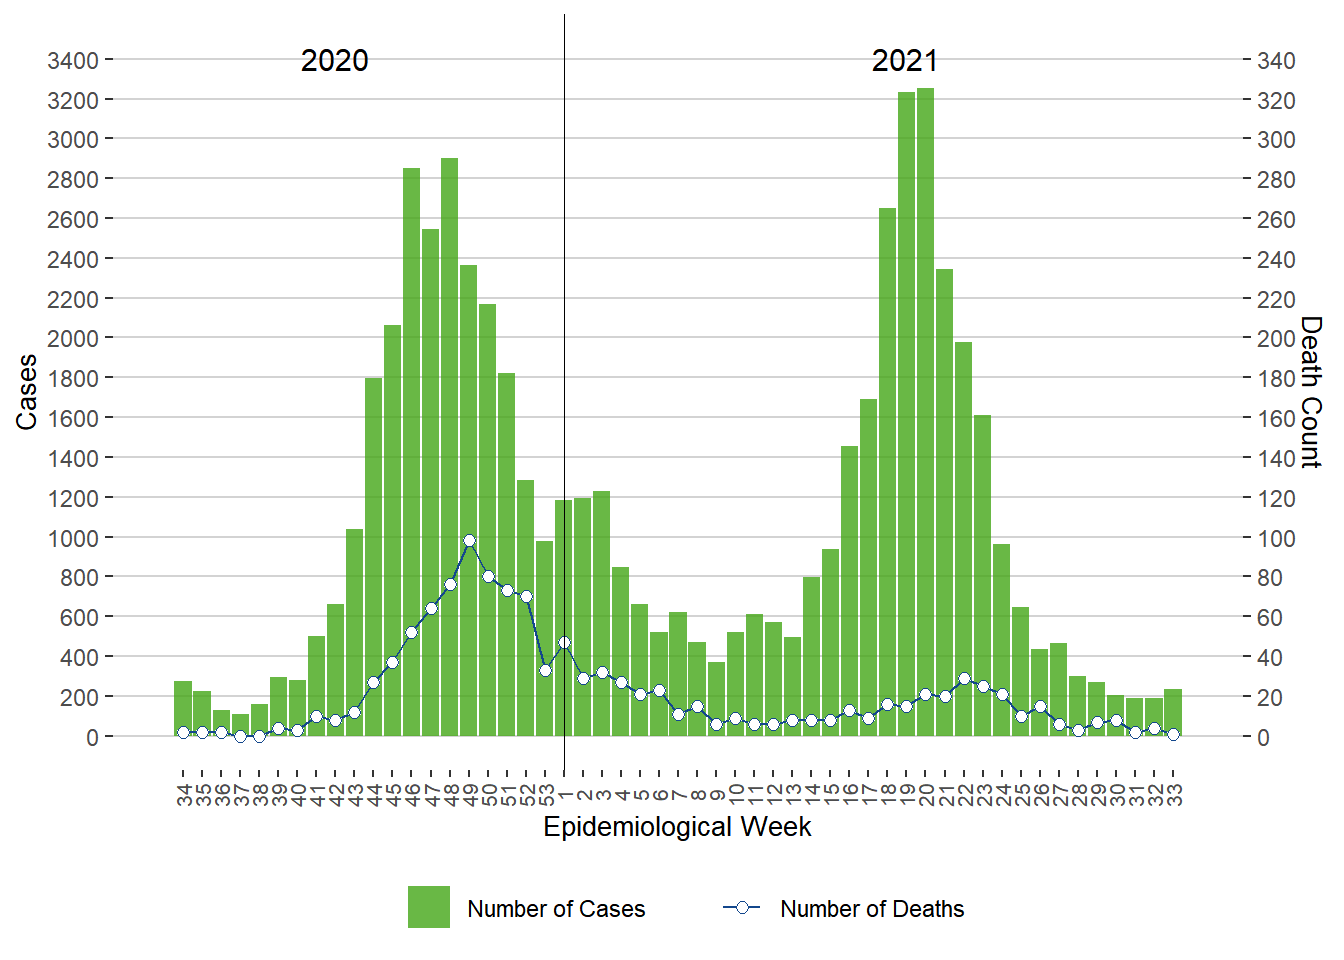
Note. Deaths due to COVID-19 were aligned by week of death date.
Back
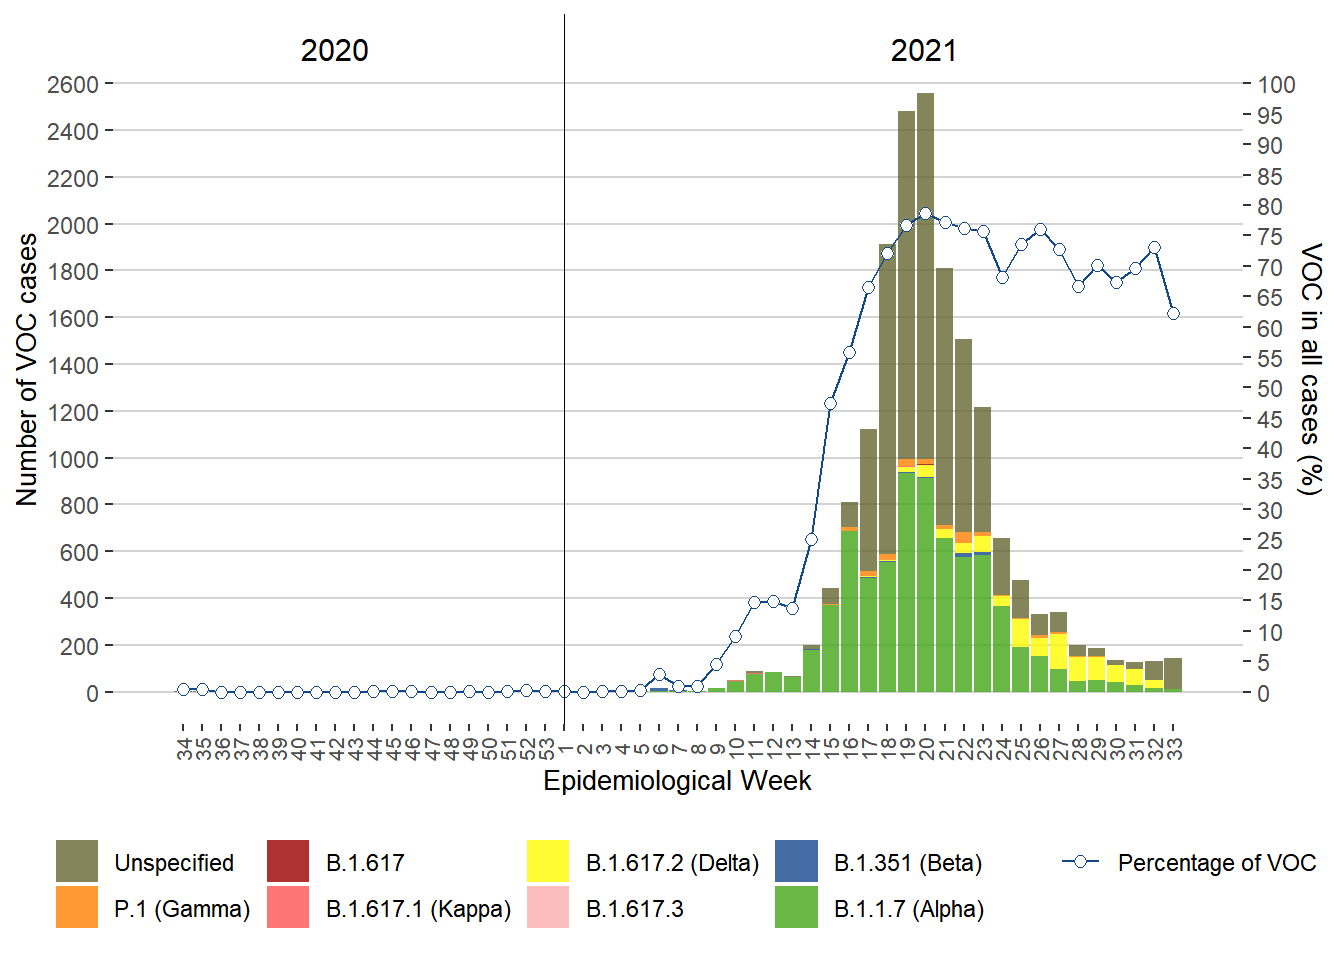
Figure 2. COVID-19 Cases of Variants of Concern (VOC) by Type and Percentage of VOC Cases in All Cases by Week of Public Health Report Date, Manitoba, August 16, 2020 – August 21, 2021
 Back
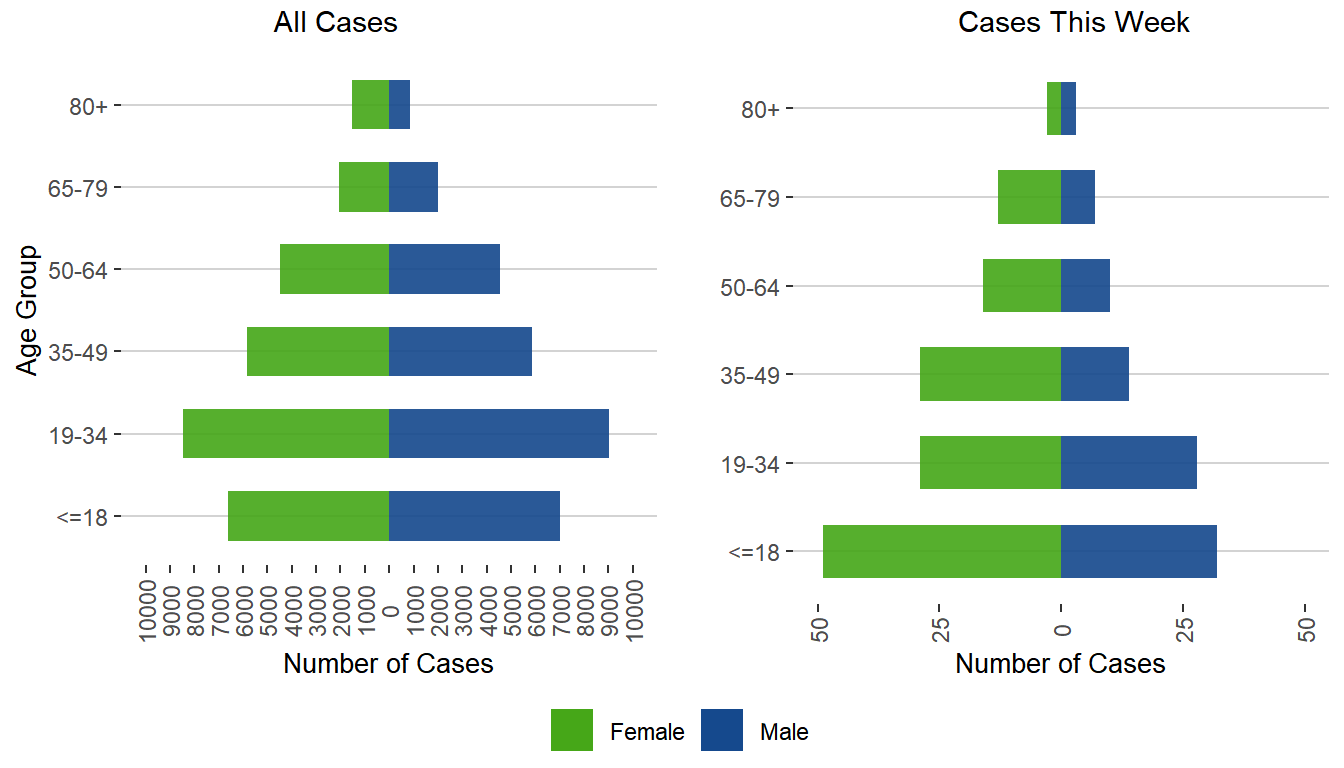
Back Figure 3. Sex and Age Distribution of COVID-19 Cases, March 1, 2020 – August 21, 2021
 Back
Back
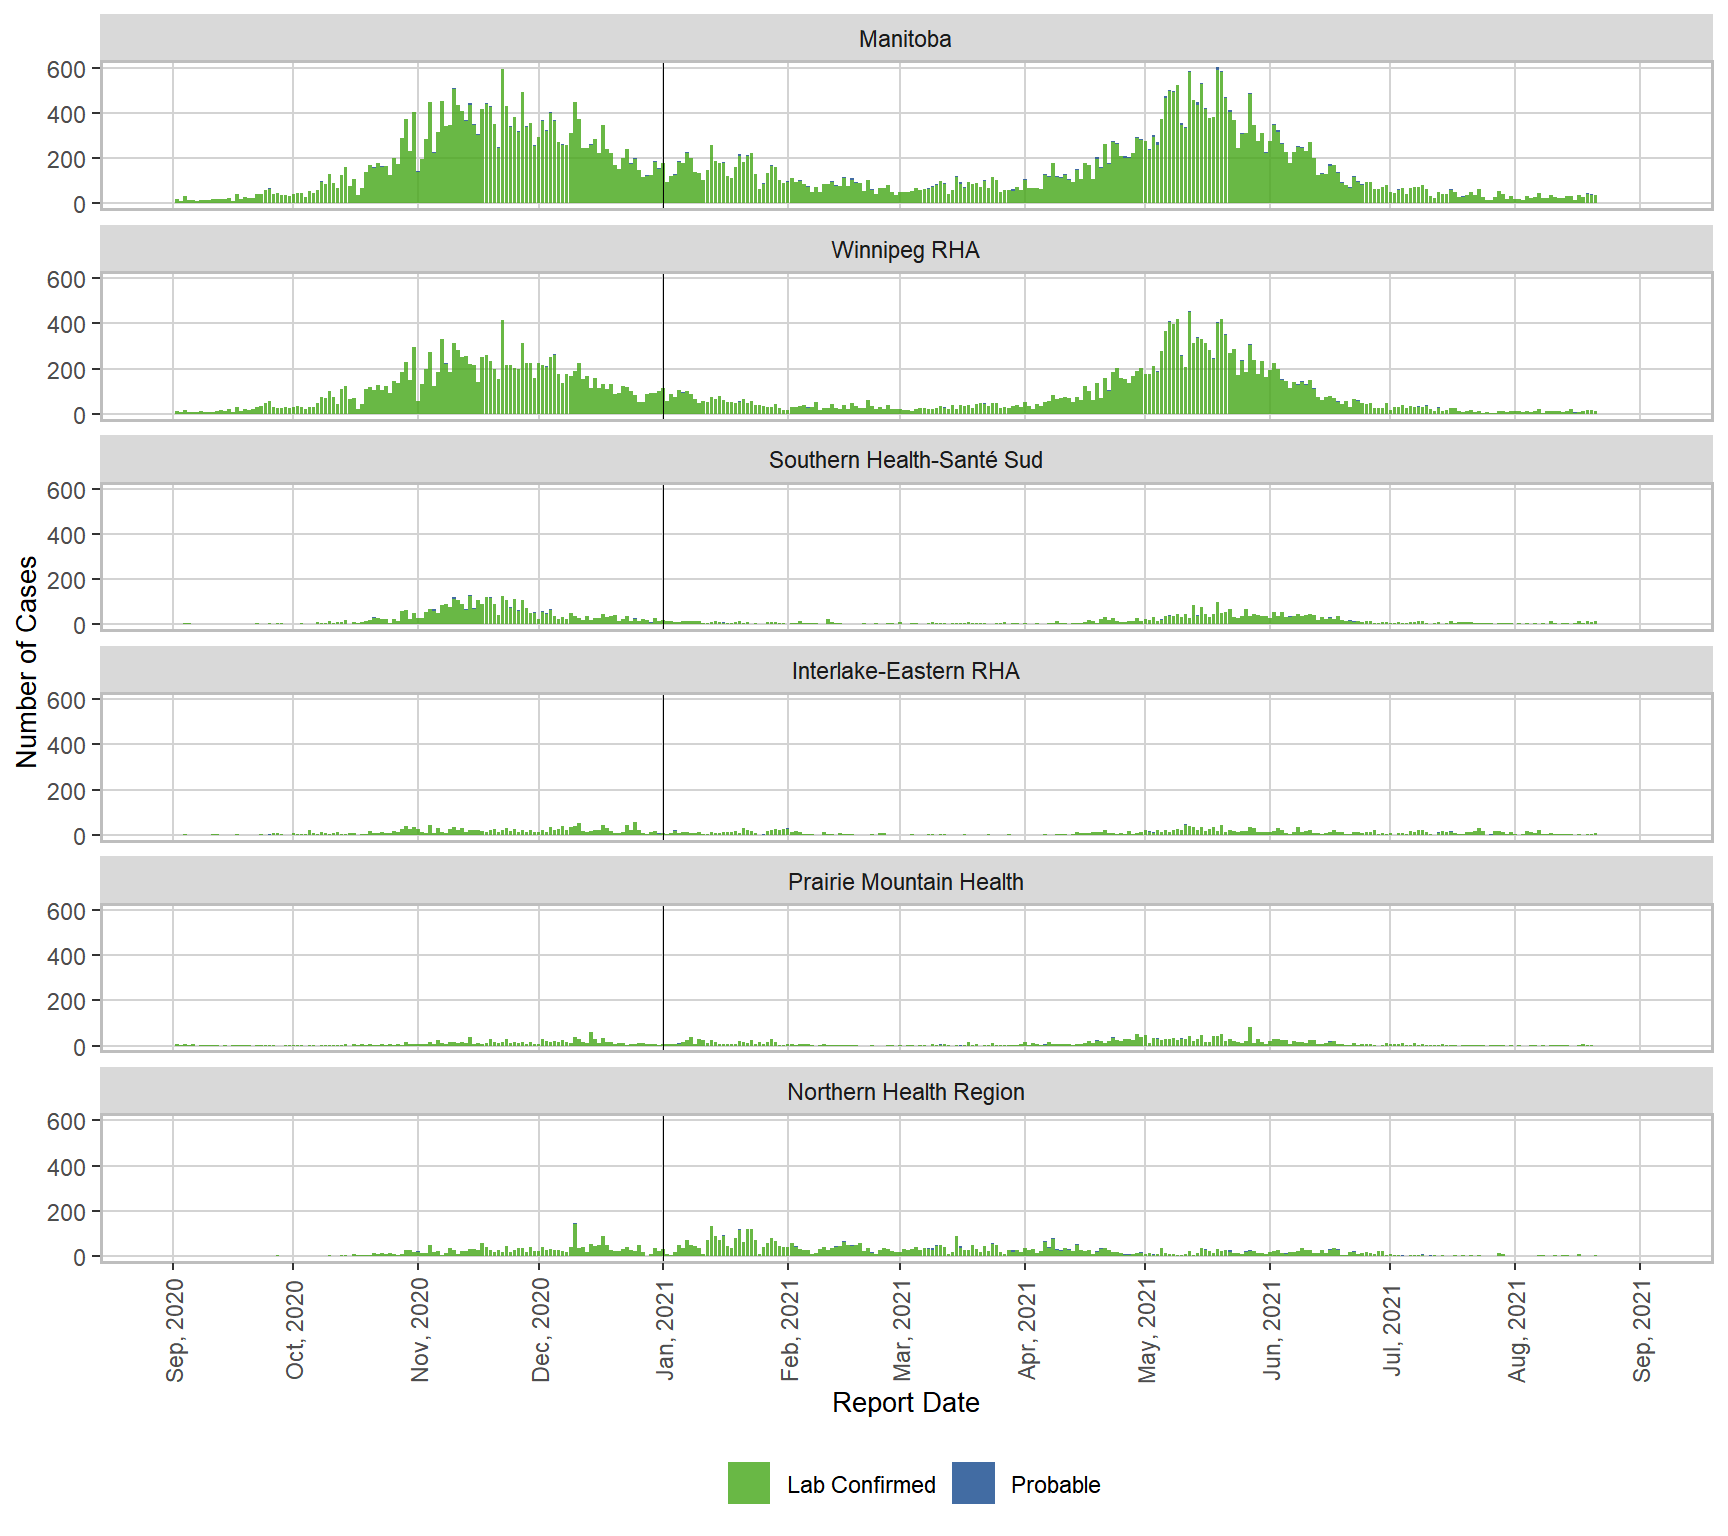
Figure 4. Cases of COVID-19 by Health Region and Public Health Report Date, Manitoba, September 1, 2020 – September 1, 2021
 Back
Back Table 1. Cases of COVID-19 by Health Region, Manitoba, March 13, 2020 – August 21, 2021
| Health Region | Cases | Percentage |
|---|---|---|
| Winnipeg RHA | 34115 | 58.6% |
| Southern Health-Santé Sud | 7788 | 13.4% |
| Interlake-Eastern RHA | 4286 | 7.4% |
| Prairie Mountain Health | 4039 | 6.9% |
| Northern Health Region | 8032 | 13.8% |
Testing
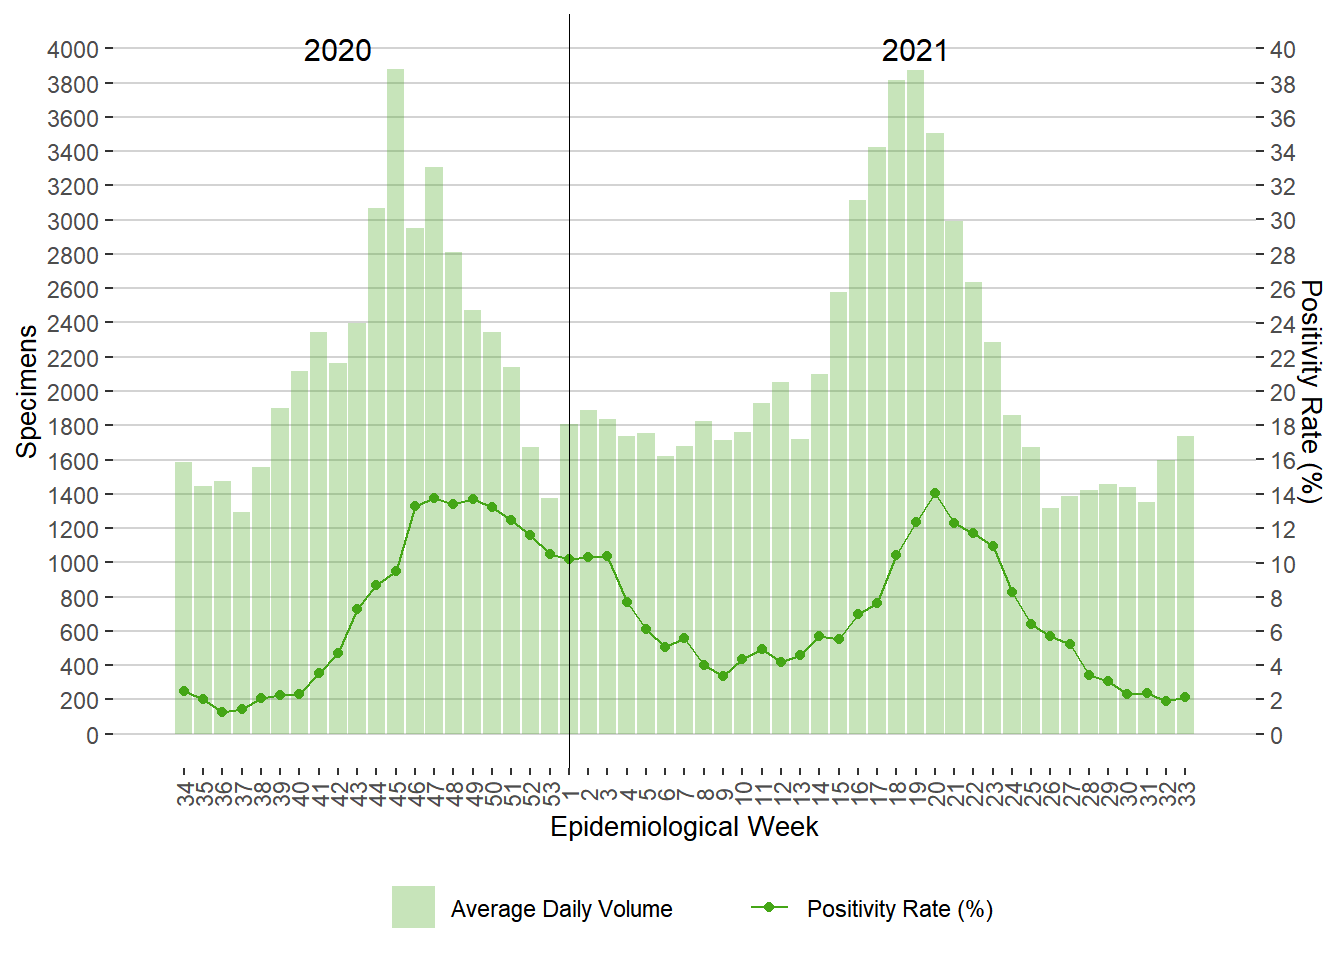
Figure 5. Average Daily Testing Volume and Positivity (%) for COVID-19 by Week of Specimen Receiving Date, Manitoba, August 16, 2020 – August 21, 2021
 Back
Back Table 2. Cumulative National Testing Volume and Positivity (%) for COVID-19 by Province/Territory, Canada, March 13, 2020 – August 21, 2021
| Province | Confirmed Cases | Tests Completed | Test Rate in Population (Estimated %) | Positivity Rate (Estimated %) |
|---|---|---|---|---|
| Alberta | 242,997 | 4,991,003 | 114.7% | 4.9% |
| British Columbia | 158,919 | 3,287,396 | 65.1% | 4.8% |
| Manitoba | 58,176 | 951,881 | 69.8% | 6.1% |
| New Brunswick | 2,614 | 408,857 | 52.8% | 0.6% |
| Newfoundland and Labrador | 1,458 | 317,700 | 60.8% | 0.5% |
| Northwest Territories | 300 | 26,844 | 59.8% | 1.1% |
| Nova Scotia | 5,956 | 1,082,416 | 112.0% | 0.6% |
| Nunavut | 657 | 18,821 | 48.7% | 3.5% |
| Ontario | 558,101 | 16,806,465 | 116.0% | 3.3% |
| Prince Edward Island | 221 | 182,961 | 117.5% | 0.1% |
| Quebec | 383,718 | 10,657,237 | 126.2% | 3.6% |
| Saskatchewan | 52,065 | 990,445 | 84.6% | 5.3% |
| Yukon | 671 | 9,129 | 22.5% | 7.4% |
| Canada | 1,465,866 | 39,731,231 | 106.2% | 3.7% |
Note. National testing data are collected daily from the national Coronavirus disease (COVID-19) Outbreak update webpage.
Severity
Figure 6. Severe Outcomes of COVID-19 by Week of Public Health Report Date, Manitoba, August 16, 2020 – August 21, 2021
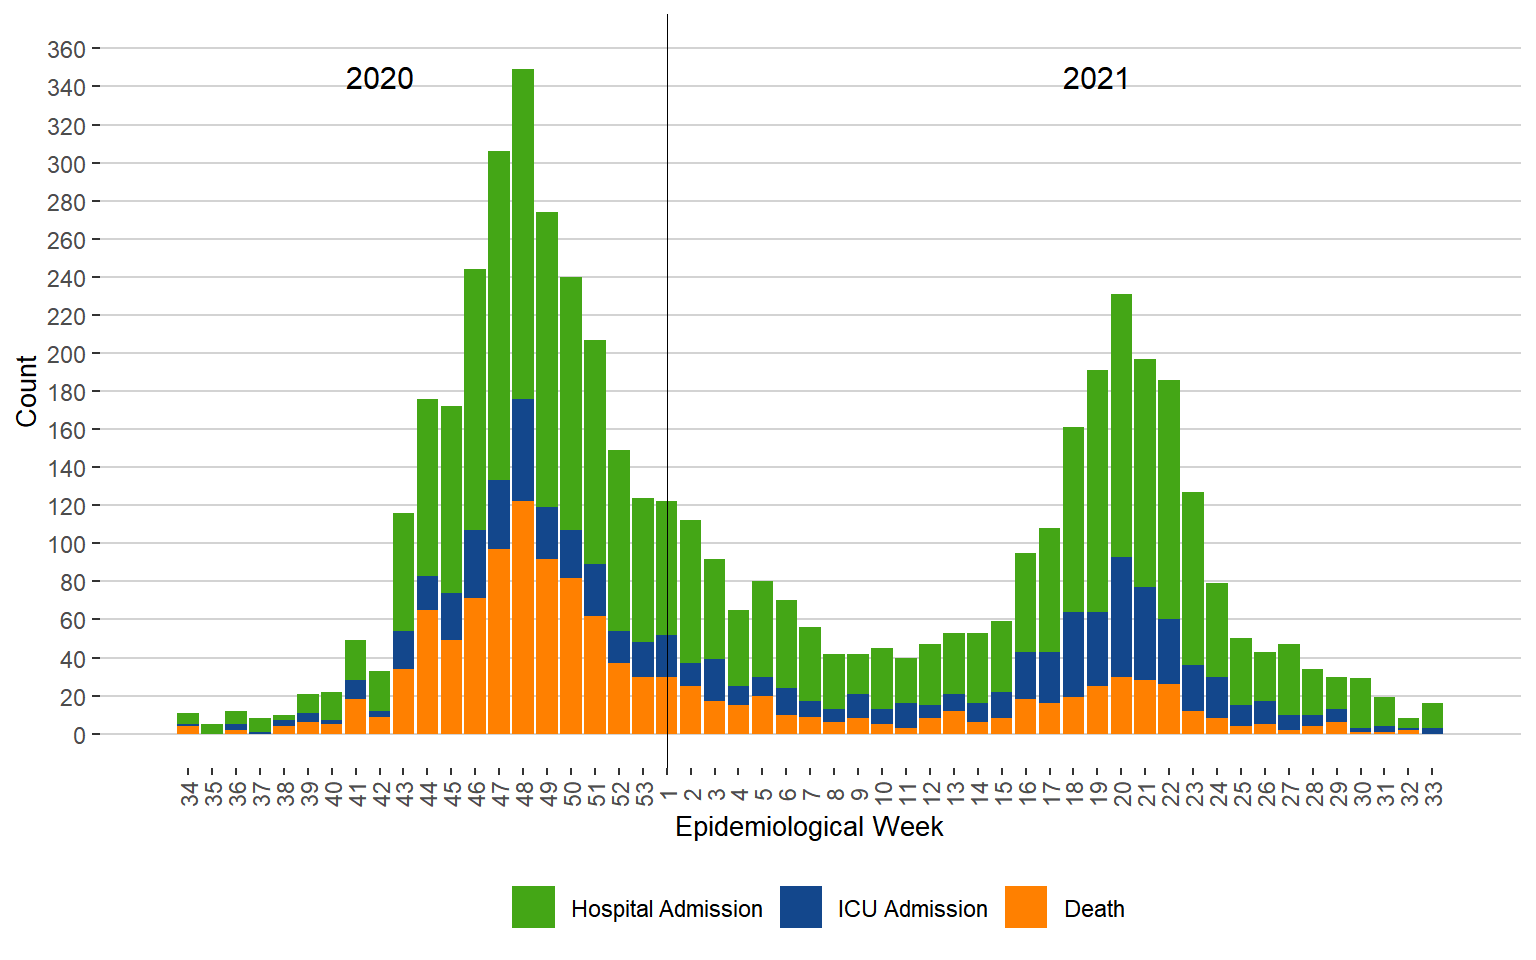
Note. ICU admissions are not included in the hospital admissions.
Figure 7. Age Distribution of Severe COVID-19 Cases Compared to All Cases, Manitoba, March 13, 2020 – August 21, 2021
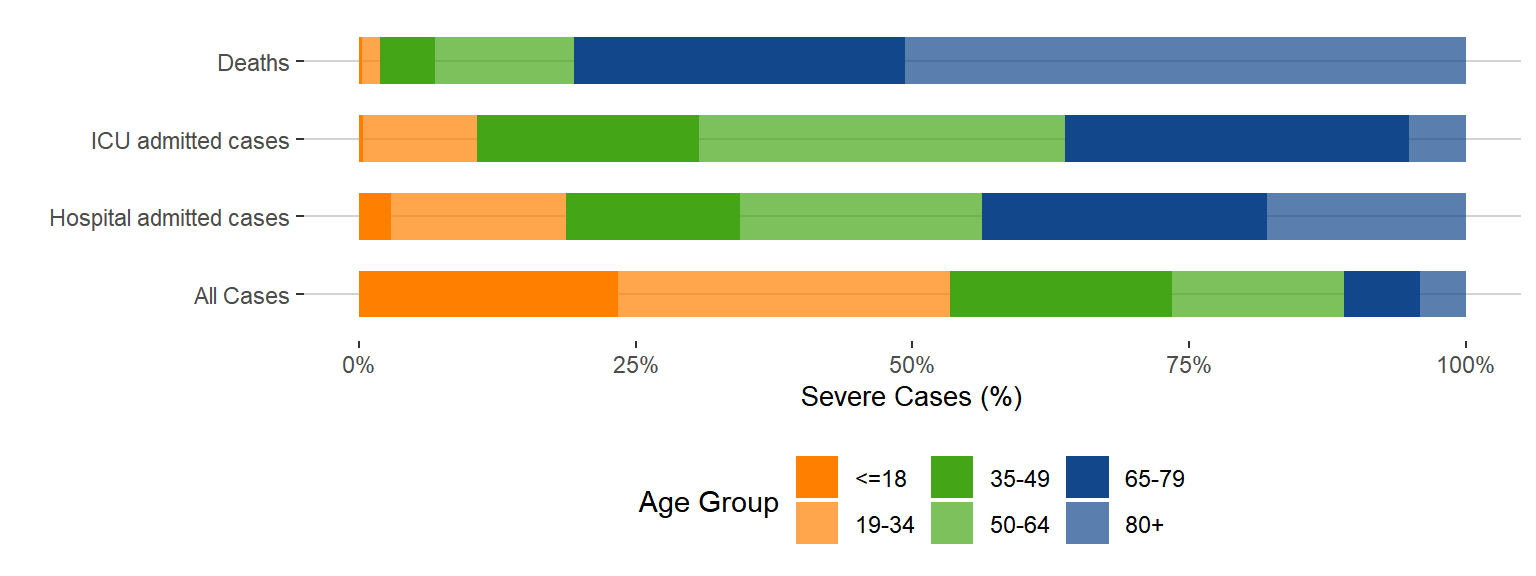
Figure 8. Percentage of COVID-19 Cases With Underlying Illnesses, Manitoba, March 13, 2020 – August 21, 2021
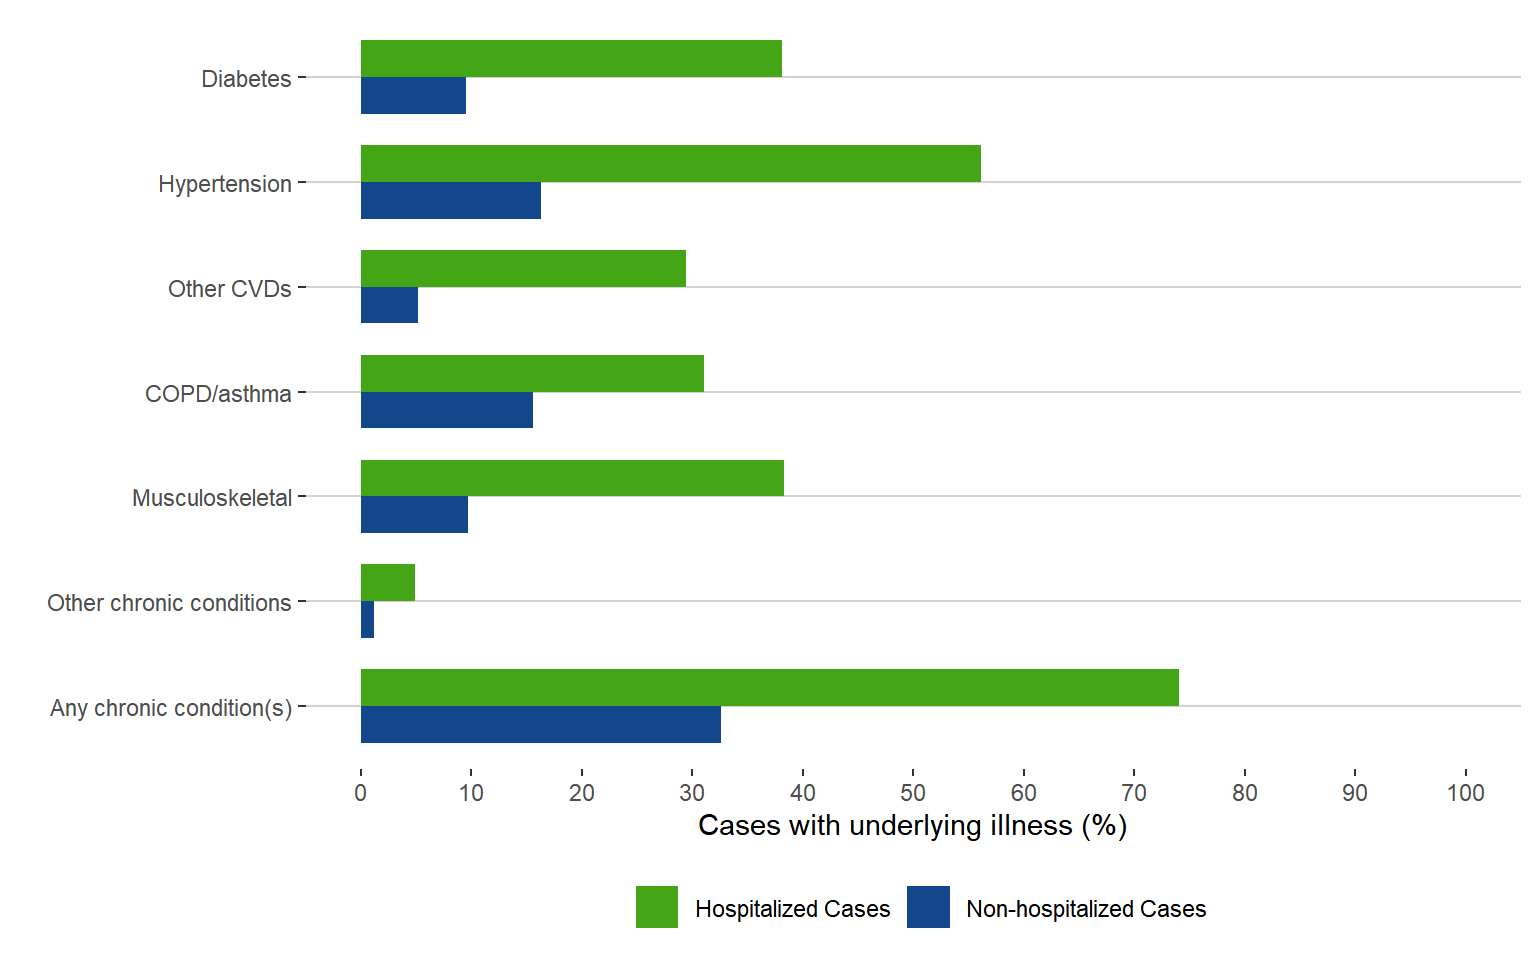
Note. Musculoskeletal illnesses include: osteoporosis, osteoarthritis, juvenile idiopathic arthritis, gout and crystal Arthropathies; COPD-chronic obstructive pulmonary disease; CVD-cardiovascular disease; Other CVDs include: ischemic heart disease, heart failure, acute myocardial infarction, and stroke; Other chronic conditions include: parkinson’s disease, multiple sclerosis, alzheimer’s disease and epilepsy. About definitions of chronic conditions
Risk Factors
Table 3. Source of Infection in Health Care Workers with Non-missing Information, Manitoba, March 13, 2020 – August 21, 2021
| Source of Infection | Cases | Percentage |
|---|---|---|
| Close contact of known case | 1525 | 58.4% |
| Pending | 200 | 7.7% |
| Travel | 28 | 1.1% |
| Unknown | 859 | 32.9% |
| All Cases | 2612 |
Table 4. Roles of Health Care Workers with Non-missing Information, Manitoba, March 13, 2020 – August 21, 2021
| Role | Cases | Percentage |
|---|---|---|
| Allied Health, Health Professionals, and Support Staff | 1596 | 61.1% |
| Nurse/Licensed Practical Nurse | 668 | 25.6% |
| Not identified | 204 | 7.8% |
| Physician/Physician in training | 88 | 3.4% |
| First Responder | 56 | 2.1% |
| All Cases | 2612 |
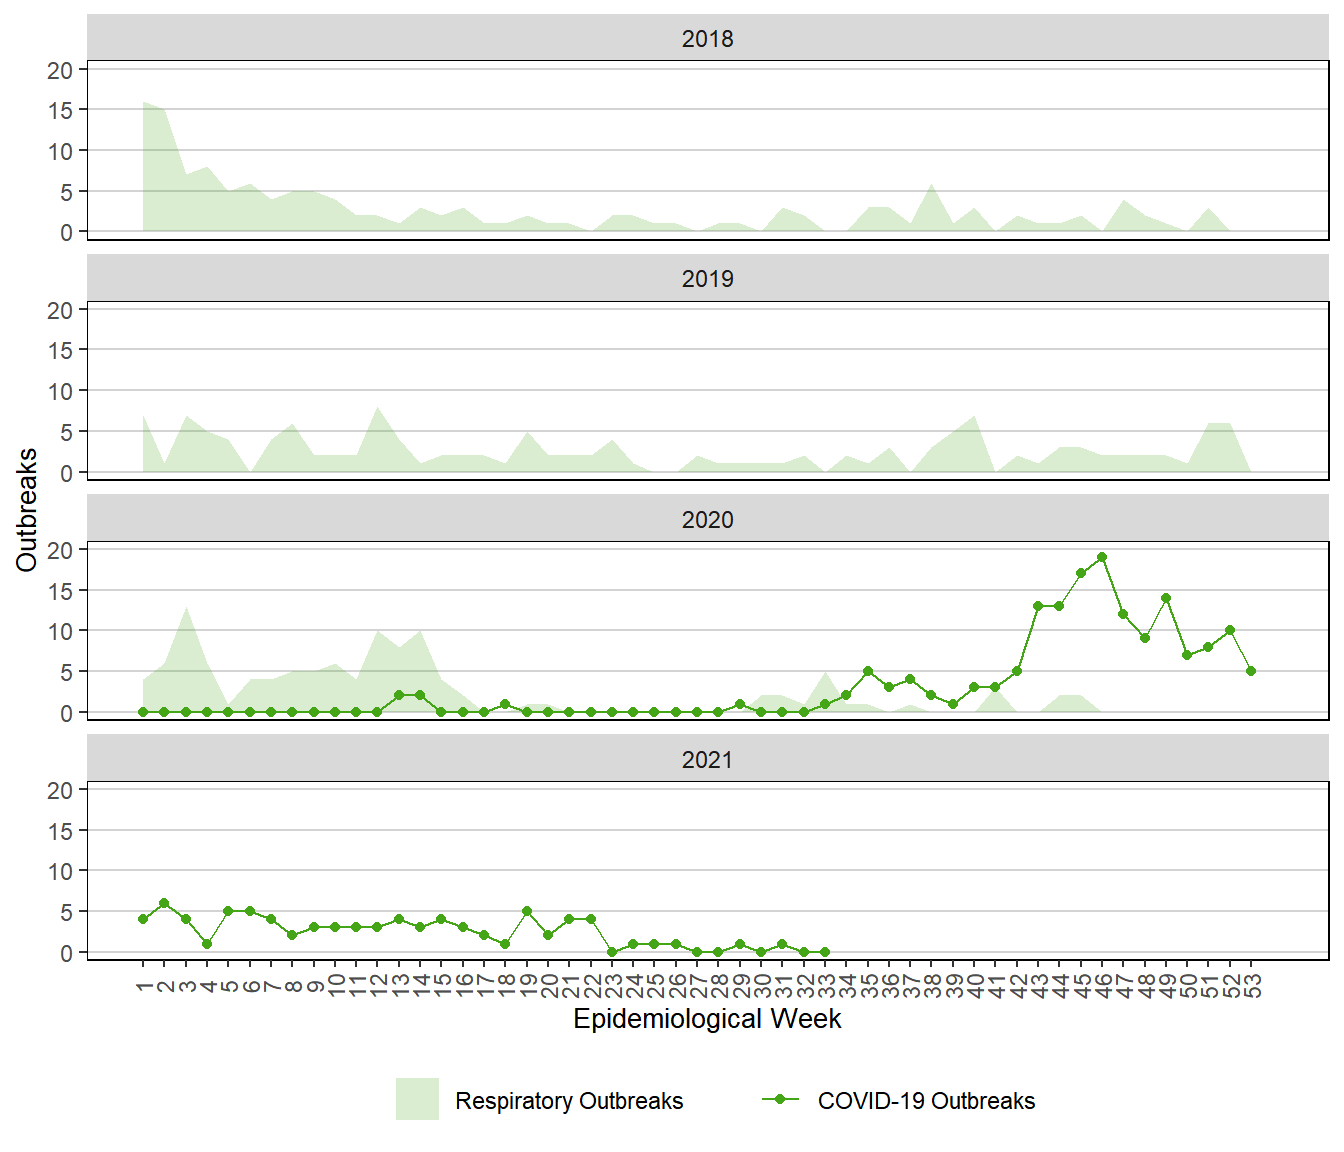
Outbreaks
Figure 9. Weekly Respiratory and COVID-19 Outbreaks, Manitoba, 2018 – 2021
Contacts
Table 5. COVID-19 Contact Summary in All Cases, Manitoba, March 13, 2020 – August 21, 2021
| Regional Health Authority | Cases | Median Contacts | Minimum Contacts | Maximum Contacts |
|---|---|---|---|---|
| Winnipeg Health | 34115 | 3 | 0 | 249 |
| Northern Health | 8032 | 1 | 0 | 121 |
| Southern Health - Sante Sud | 7788 | 2 | 0 | 69 |
| Interlake-Eastern Health | 4286 | 1 | 0 | 76 |
| Prairie Mountain Health | 4039 | 3 | 0 | 134 |
Table 6. COVID-19 Contact Summary in New Cases Reported in Week 33, Manitoba, 2021
| Regional Health Authority | Cases | Median Contacts | Minimum Contacts | Maximum Contacts |
|---|---|---|---|---|
| Winnipeg Health | 96 | 4.0 | 0 | 38 |
| Southern Health - Sante Sud | 74 | 2.5 | 0 | 44 |
| Interlake-Eastern Health | 27 | 2.0 | 0 | 8 |
| Northern Health | 21 | 2.0 | 0 | 12 |
| Prairie Mountain Health | 15 | 3.0 | 0 | 14 |
Figure 10. Percentage of COVID-19 Cases Linked to Top-five Cluster/Outbreak/Special Investigation Settings, Manitoba, January 24, 2021 – August 21, 2021
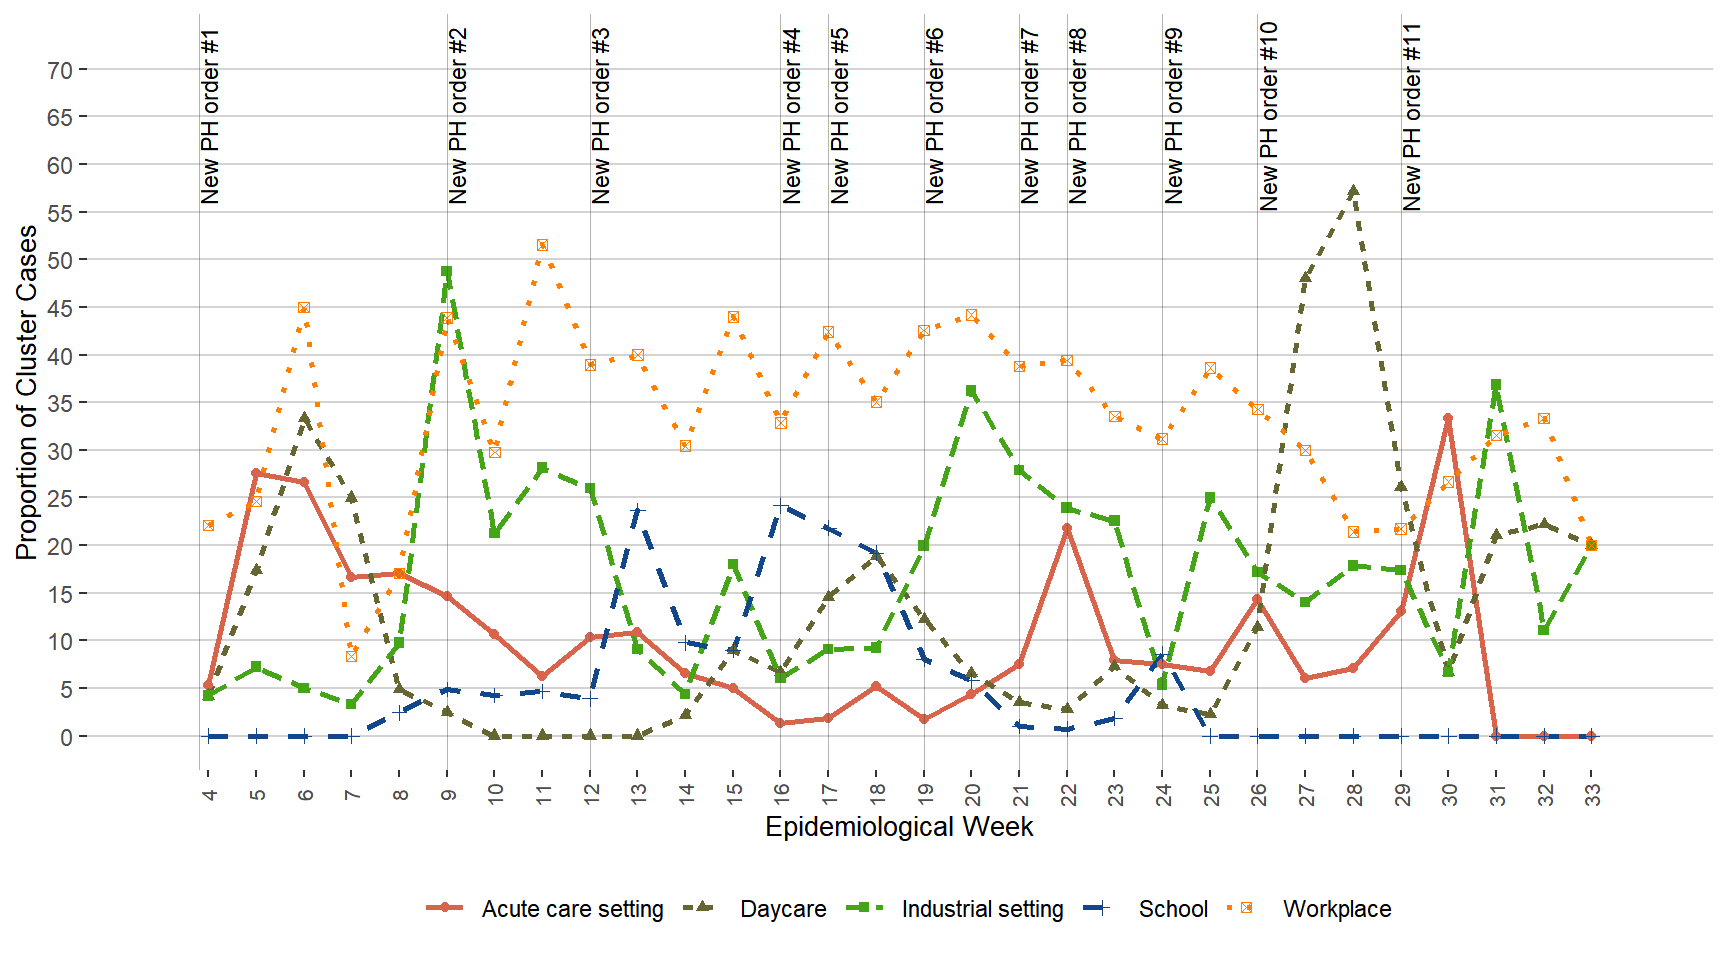
Note: COVID-19 public health orders in Manitoba since January 23, 2021: PH order #1 (effective January 23, 2021), PH order #2 (effective March 5, 2021), PH order #3 (effective March 26, 2021), PH order #4 (effective April 19, 2021), PH order #5 (effective April 28, 2021), PH order #6 (effective May 9, 2021), PH order #7 (effective May 22, 2021), PH order #8 (effective May 29, 2021), PH order #9 (effective June 12, 2021), PH order #10 (effective June 26, 2021), PH order #11: (effective July 17, 2021). Content of Public Health Orders
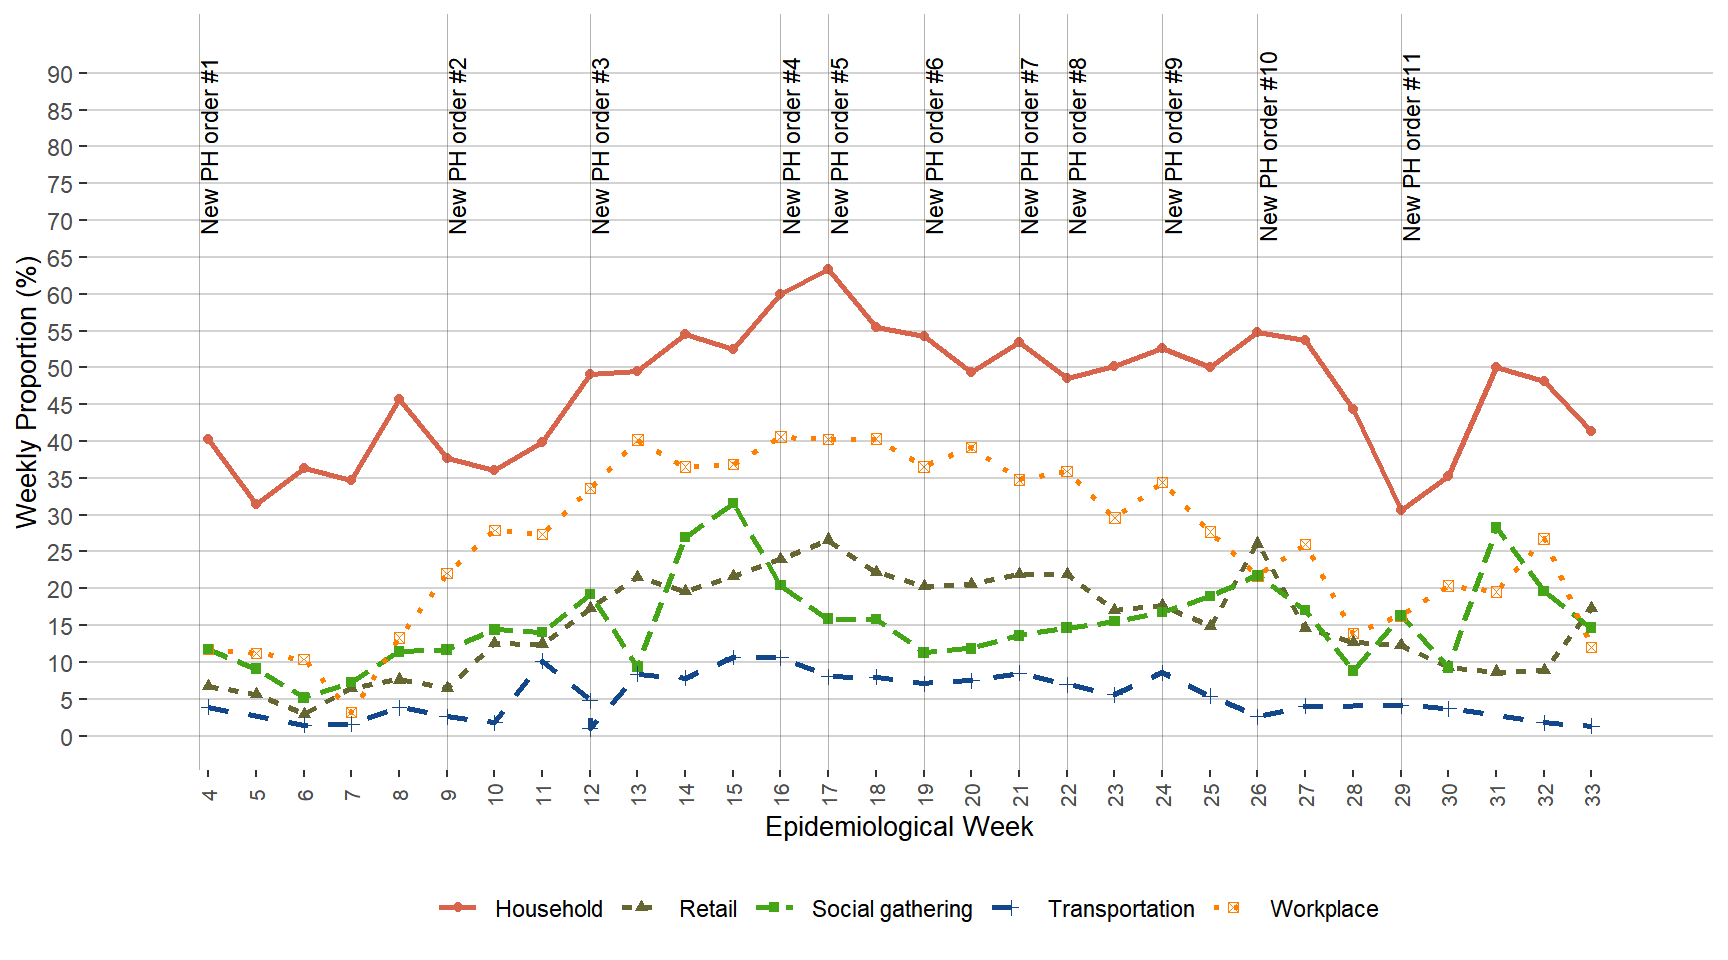
Figure 11. Percentage of Total COVID-19 Cases Exposed to Top-five Transmission Settings, Manitoba, January 24, 2021 – August 21, 2021
Note: COVID-19 public health orders in Manitoba since January 23, 2021: PH order #1 (effective January 23, 2021), PH order #2 (effective March 5, 2021), PH order #3 (effective March 26, 2021), PH order #4 (effective April 19, 2021), PH order #5 (effective April 28, 2021), PH order #6 (effective May 9, 2021), PH order #7 (effective May 22, 2021), PH order #8 (effective May 29, 2021), PH order #9 (effective June 12, 2021), PH order #10 (effective June 26, 2021), PH order #11: (effective July 17, 2021). Content of Public Health Orders
Figure 12. Percentage of Community-transmitted COVID-19 Cases Exposed to Top-five Acquisition Settings, Manitoba, January 24, 2021 – August 21, 2021
Note: COVID-19 public health orders in Manitoba since January 23, 2021: PH order #1 (effective January 23, 2021), PH order #2 (effective March 5, 2021), PH order #3 (effective March 26, 2021), PH order #4 (effective April 19, 2021), PH order #5 (effective April 28, 2021), PH order #6 (effective May 9, 2021), PH order #7 (effective May 22, 2021), PH order #8 (effective May 29, 2021), PH order #9 (effective June 12, 2021), PH order #10 (effective June 26, 2021), PH order #11: (effective July 17, 2021). Content of Public Health Orders
Symptoms
Figure 13. Percentage of Symptoms Reported by COVID-19 Cases, Manitoba, March 13, 2020 – August 21, 2021
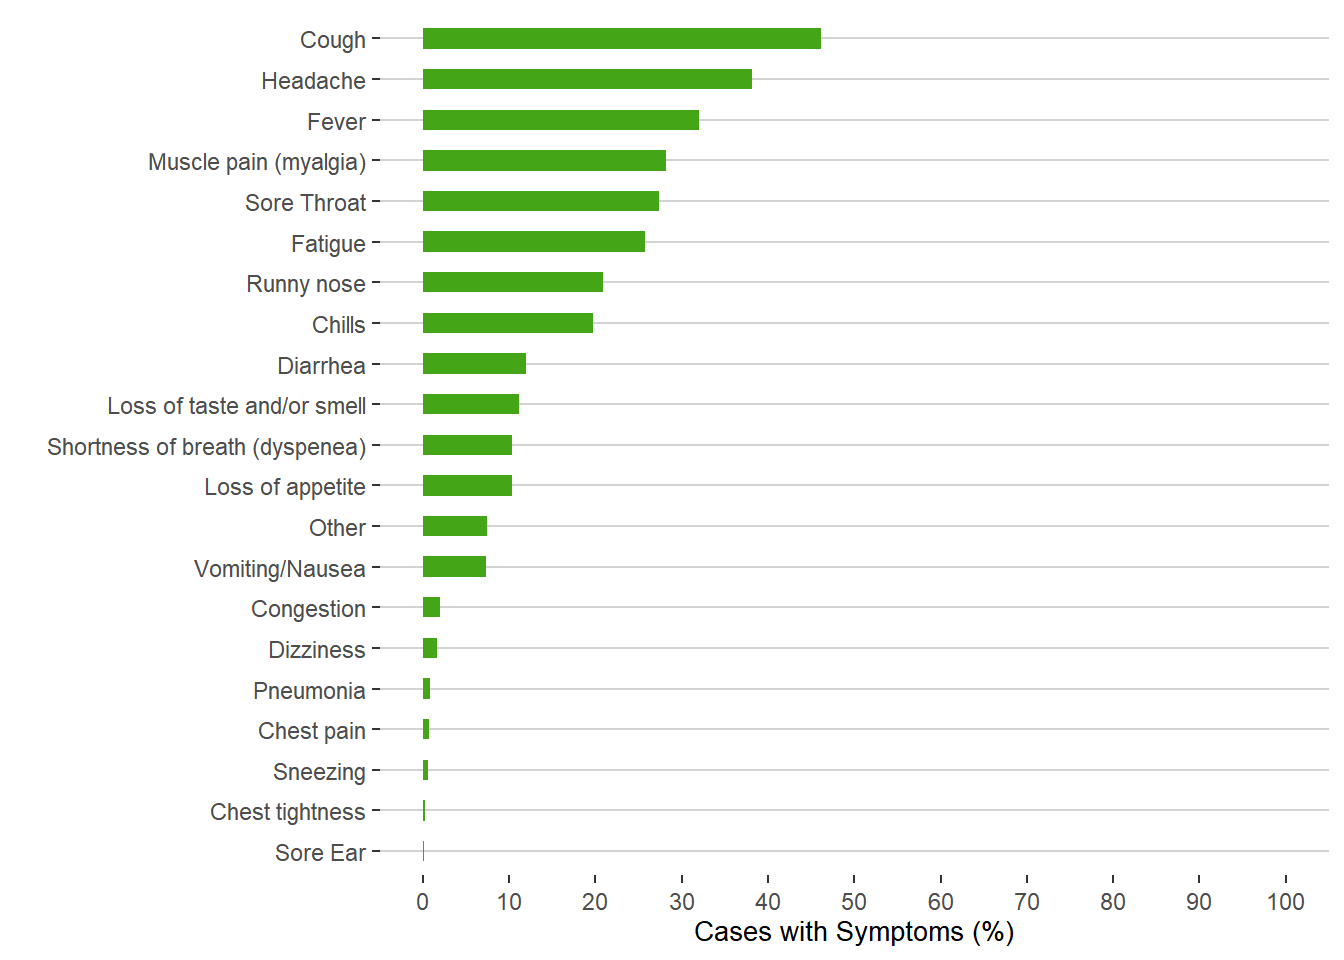
Note: Other symptoms include those less common symptoms such as sweating, runny eyes, itchy throat, etc.
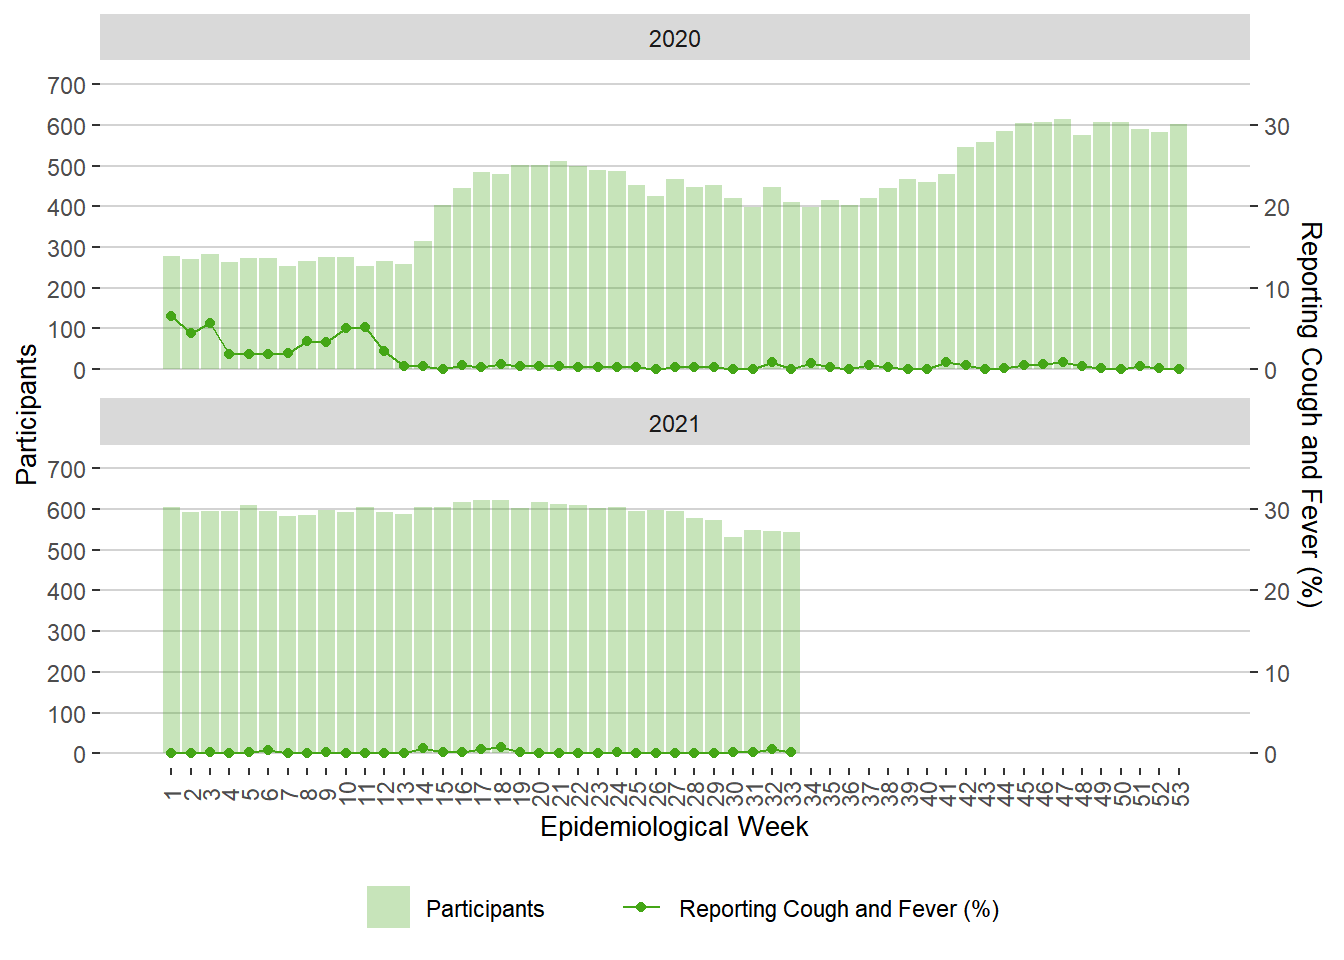
FluWatchers
Figure 14. Weekly FluWatchers Participants and Percentage Reporting Fever and Cough, Manitoba, 2020 – 2021
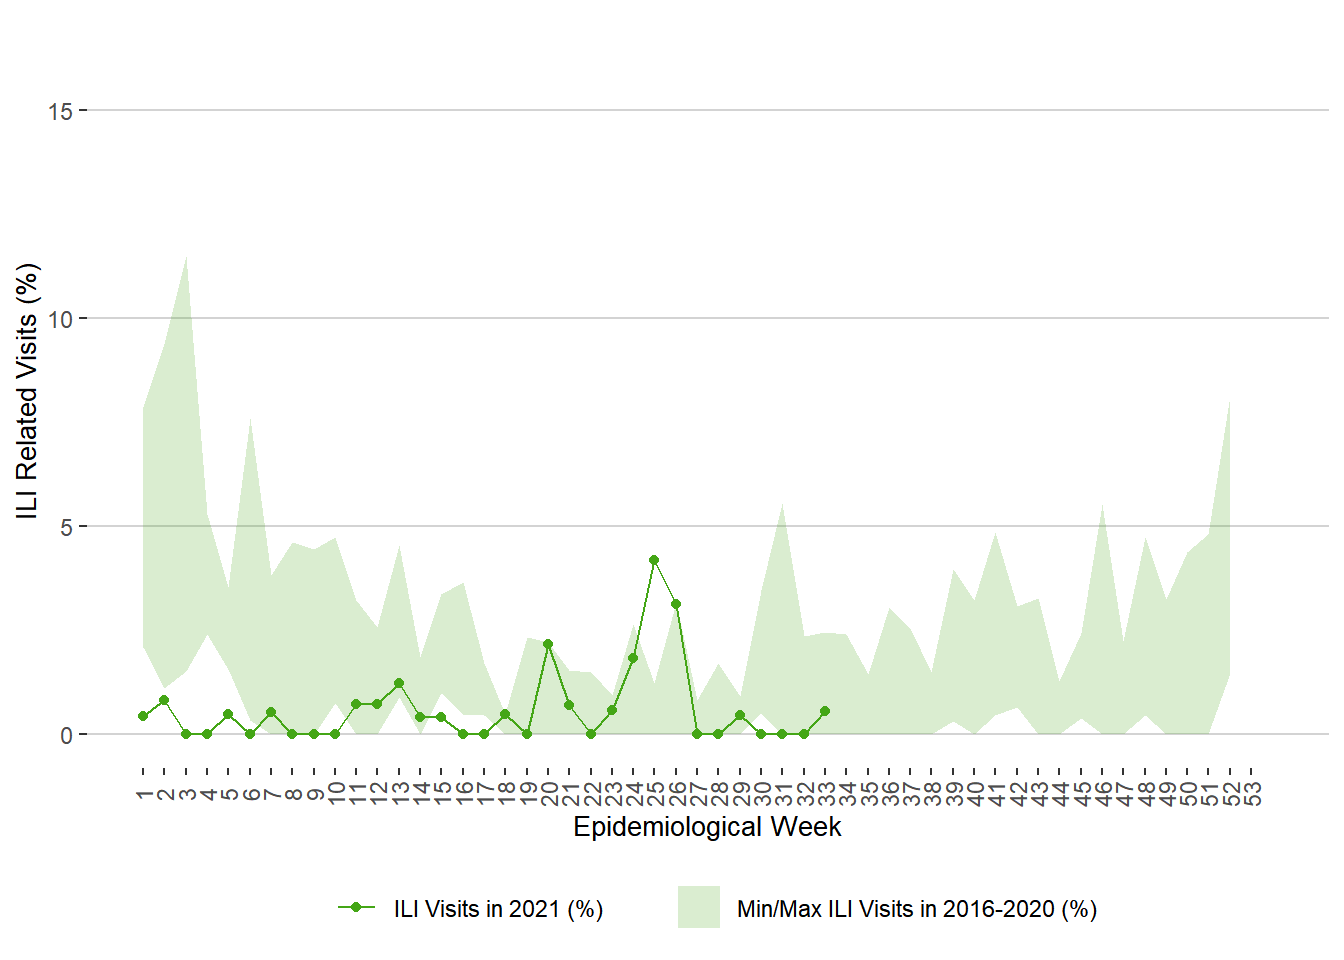
Physician Visits
Figure 15. Weekly Percentage of ILI Related Visits to Sentinel Physicians, Manitoba, 2021
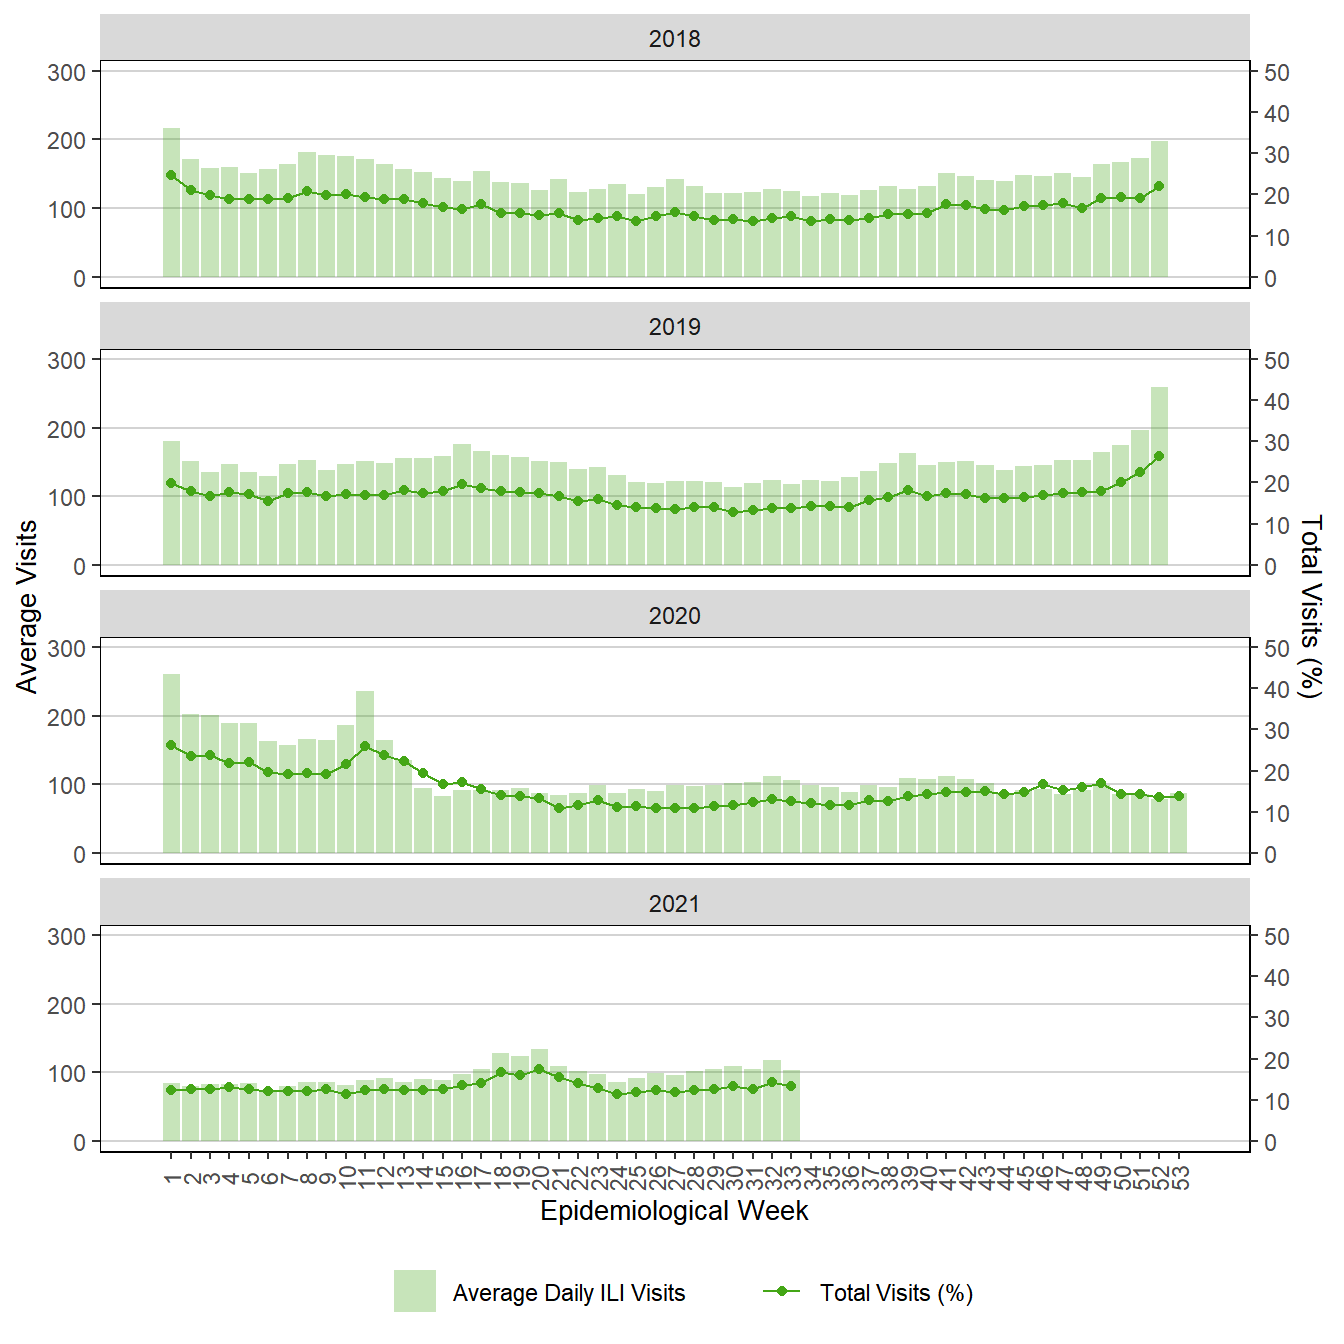
ED Visits
Figure 16. Weekly Respiratory Visits to Emergency Department, Winnipeg Regional Health Authority, Manitoba, 2018 – 2021
Epidemiology and Surveillance
Other Epidemiology and Surveillance reports
https://www.gov.mb.ca/health/publichealth/surveillance/index.html