Provincial Respiratory Surveillance Report
COVID-19 and Seasonal Influenza
2024-2025 season
*seasons are defined as June 30, 2024 to June 28, 2025
*seasons are defined as June 30, 2024 to June 28, 2025
This weekly report provides a current epidemiological update on the intensity and severity of respiratory activity in Manitoba including laboratory confirmed activity of both COVID-19 and seasonal influenza. Surveillance data include syndromic indicators, laboratory testing, associated hospitalization and mortality, and outbreaks. Updates around immunization coverage in COVID-19 and seasonal influenza are also included.
Data are reported with a one-week delay for increased data accuracy, completeness and reliability. More analyses continue to be conducted and will be added to this report as available. It is published online at approximately 3:00pm every Friday.
Week 40 (September 29 – October 5, 2024)
Data extracted up to 1:00 am on October 10, 2024
Next reporting date: October 18, 2024
COVID-19 vaccination / Seasonal Influenza vaccination
|
|
|||||||||||||
|
||||||||||||||
|
||||||||||||||
|
|
|||||||||||||
|
||||||||||||||
|
|
|
||||||||||||
|
Important Notes
|
||||||||||||||
COVID-19
Cases
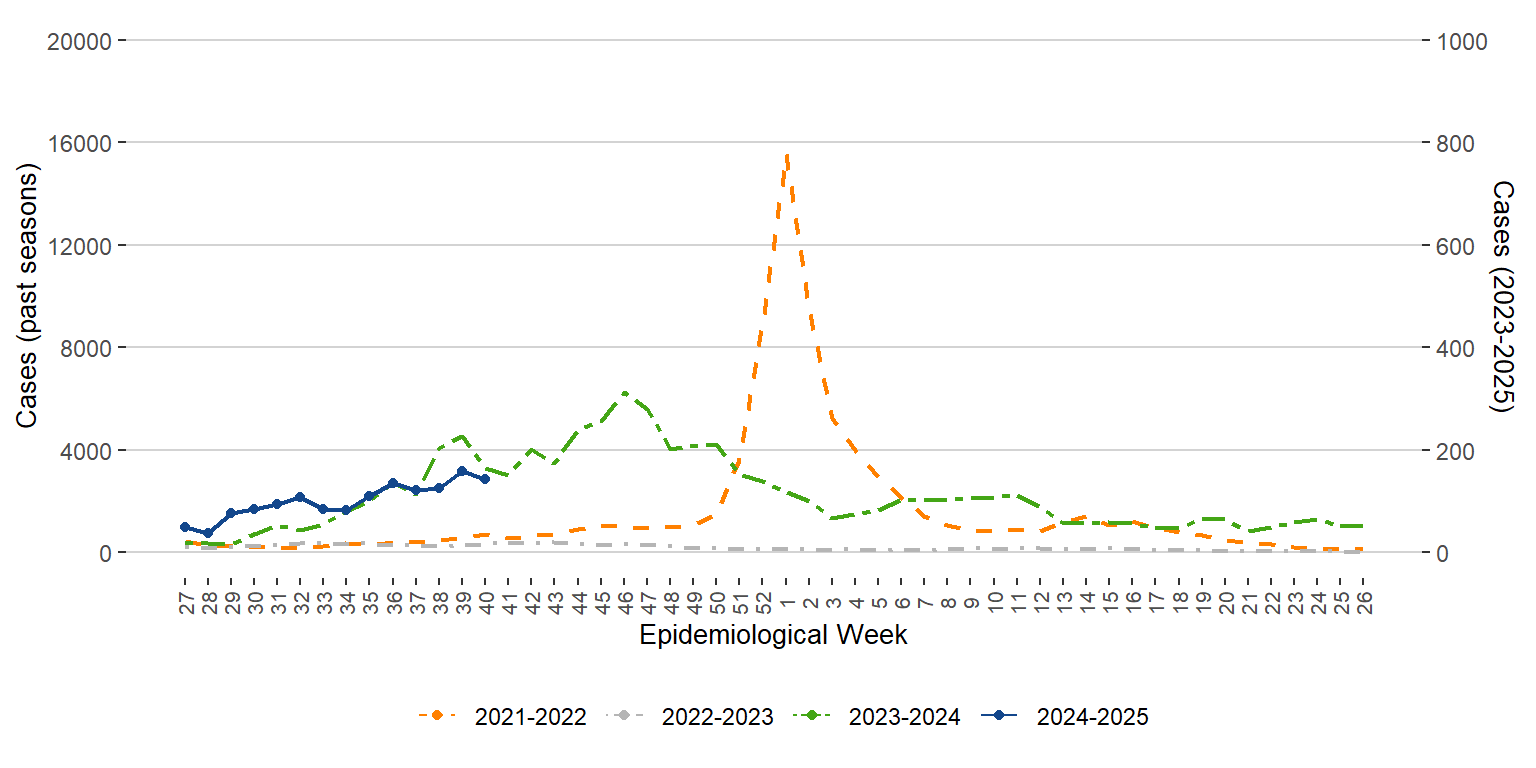
Figure 1. Weekly Cases of COVID-19 by Season, Manitoba, 2021 – 2025 (June through June)
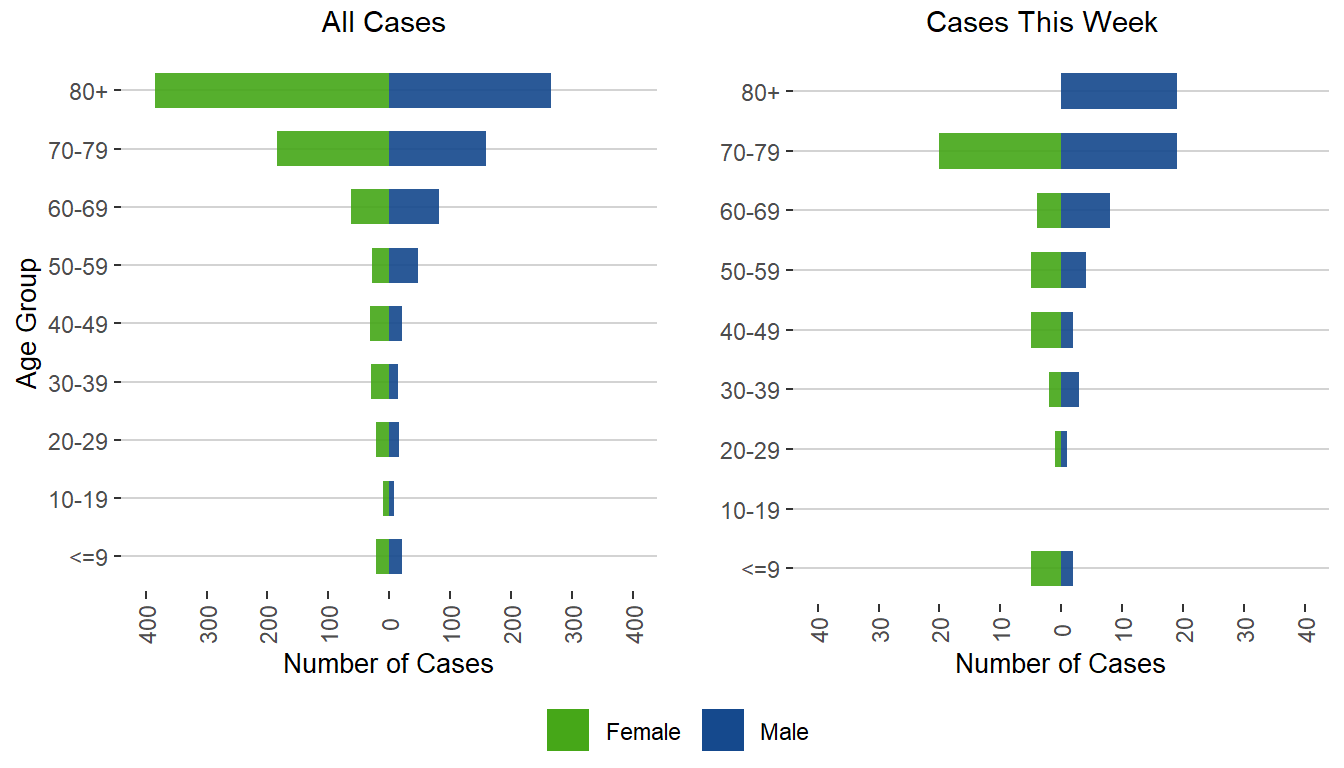
Figure 2. Sex and Age Distribution of COVID-19 Cases, Manitoba, June 30, 2024 – October 5, 2024
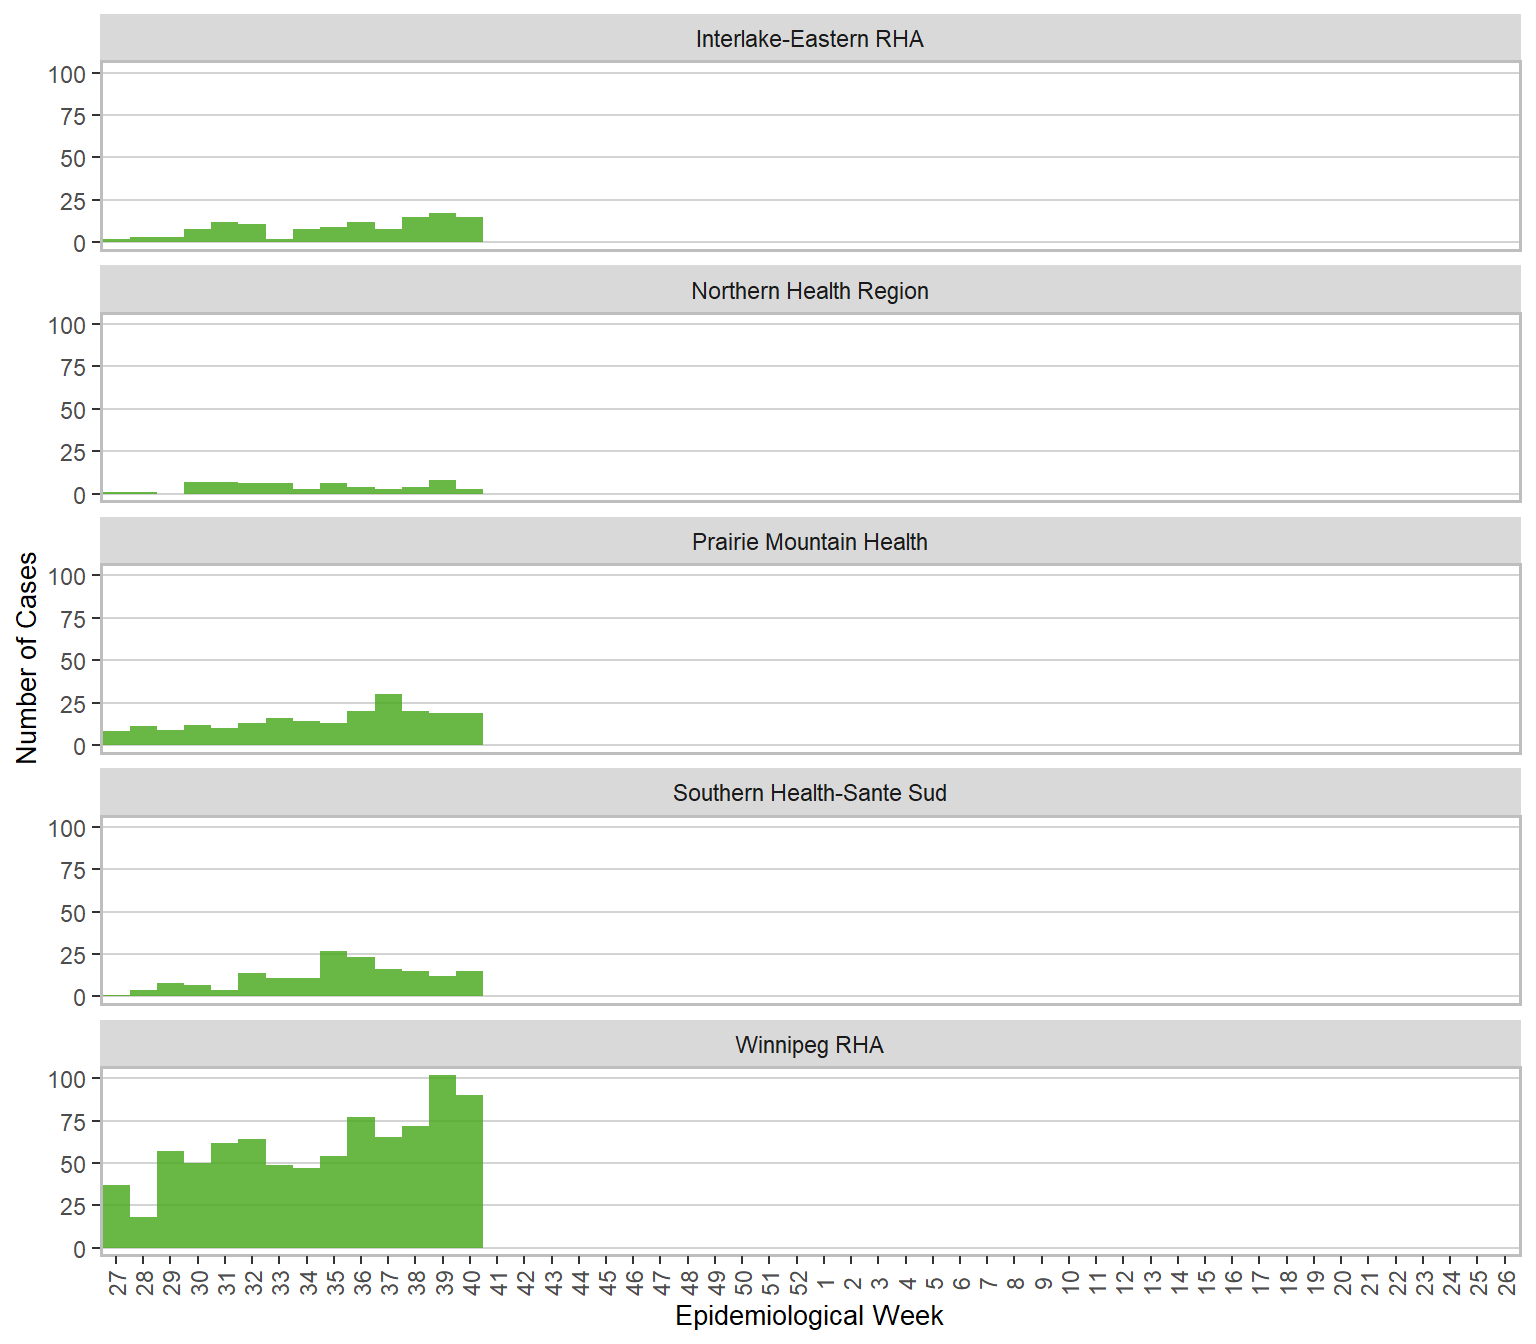
Figure 3. Cases of COVID-19 by Health Region and Public Health Report Date, Manitoba, June 30, 2024 – October 5, 2024
Testing
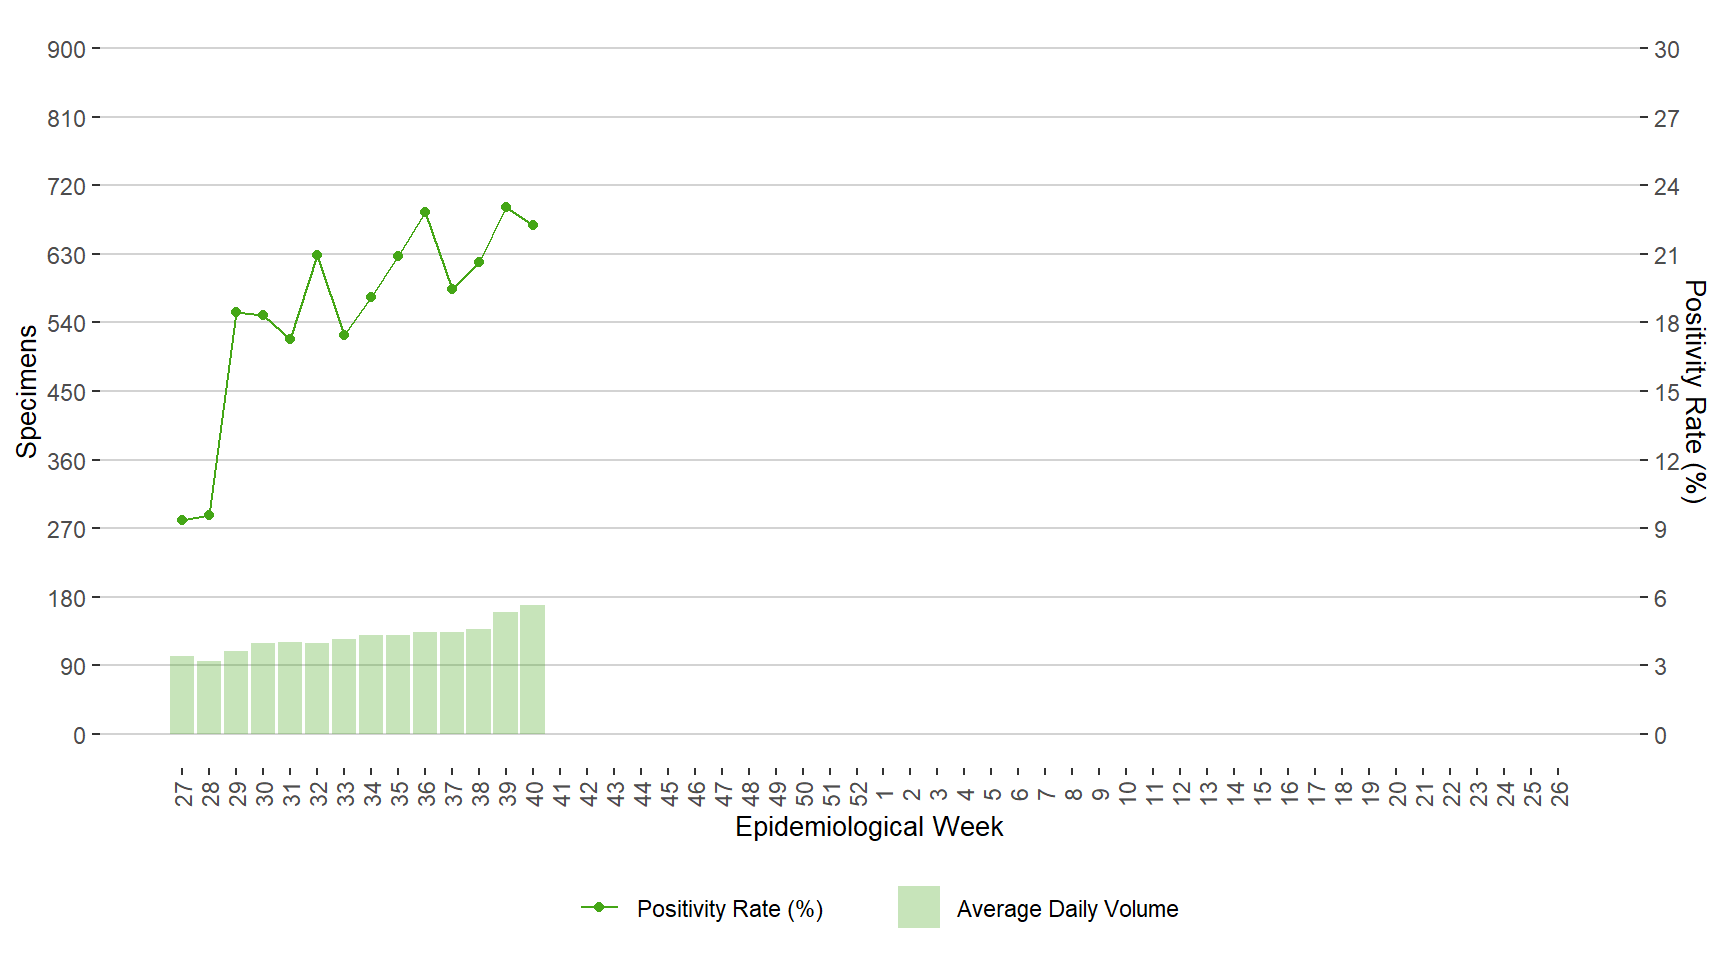
Figure 4. Average Daily Testing Volume and Positivity (%) for COVID-19 by Week of Specimen Receiving Date, Manitoba, June 30, 2024 – October 5, 2024
Vaccination
Table 1. Fall COVID-19 Campaign Coverage (at least 1 dose) and Coverage in the Last Six Months by Age Group
| Age group | Number Vaccinated | %Coverage | Number Vaccinated | %Coverage | Number Vaccinated | %Coverage |
|---|---|---|---|---|---|---|
| 00-04 | 4783 | 5.7% | 4074 | 4.8% | 240 | 0.3% |
| 05-17 | 23541 | 10.1% | 15536 | 6.7% | 245 | 0.1% |
| 18-49 | 77744 | 12.8% | 53765 | 8.8% | 796 | 0.1% |
| 50-64 | 73812 | 28.4% | 61109 | 23.5% | 1308 | 0.5% |
| 65+ | 151892 | 62.5% | 140698 | 57.9% | 10950 | 4.5% |
| All | 357102 | 25.0% | 291160 | 20.4% | 13611 | 1.0% |
Seasonal Influenza
Cases
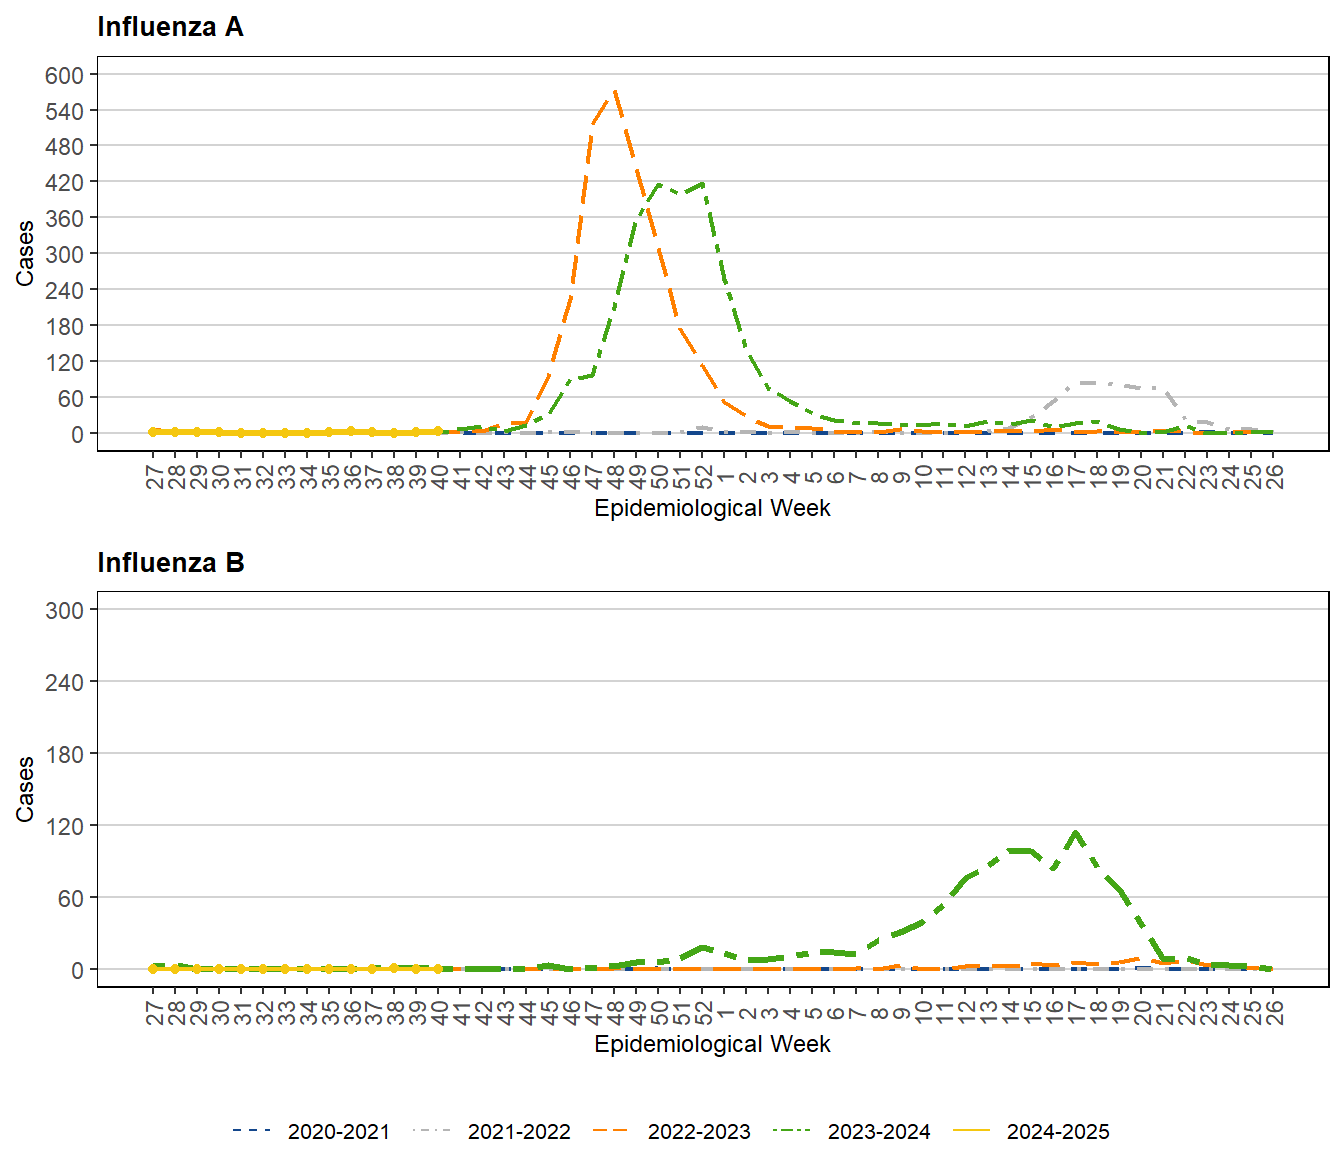
Figure 5. Weekly Cases of Influenza by Season, Manitoba, 2020 – 2025 (June through June)
 Back
Back
Testing
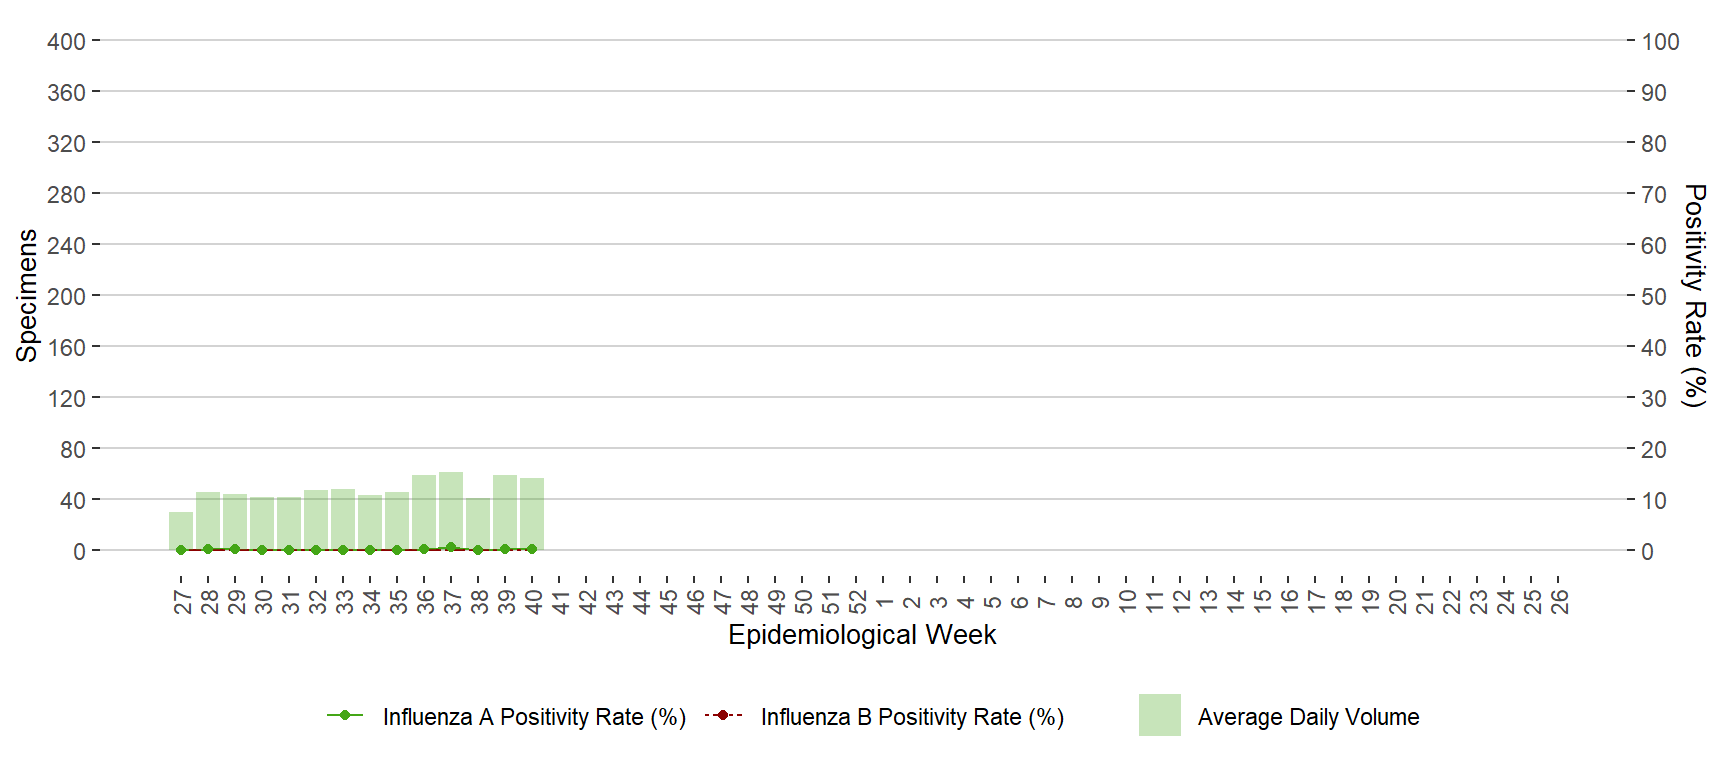
Figure 6. Average Daily Testing Volume and Positivity (%) for Influenza by Week of Specimen Receiving Date, Manitoba, June 30, 2024 – October 5, 2024
 Back
Back
Figure 7. Number of Positive Respiratory Virus Tests by Week of Specimen Receiving Date, Manitoba, June 30, 2024 – October 5, 2024
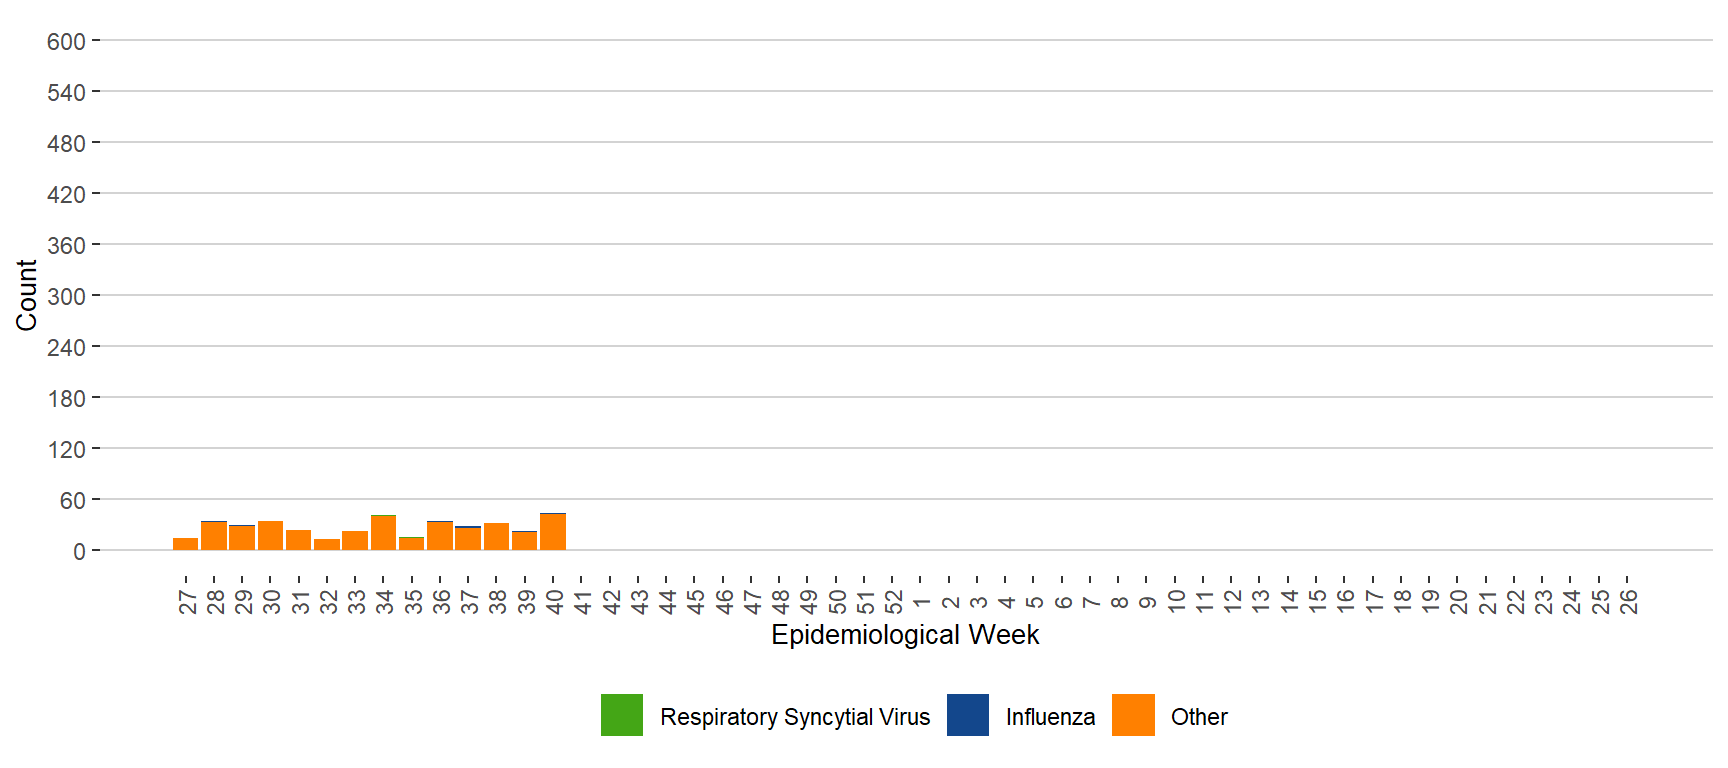
Note. Other respiratory viruses include adenovirus, enterovirus/rhinovirus, human coronavirus (seasonal), human metapneumovirus and human parainfluenza virus.
BackOutbreaks
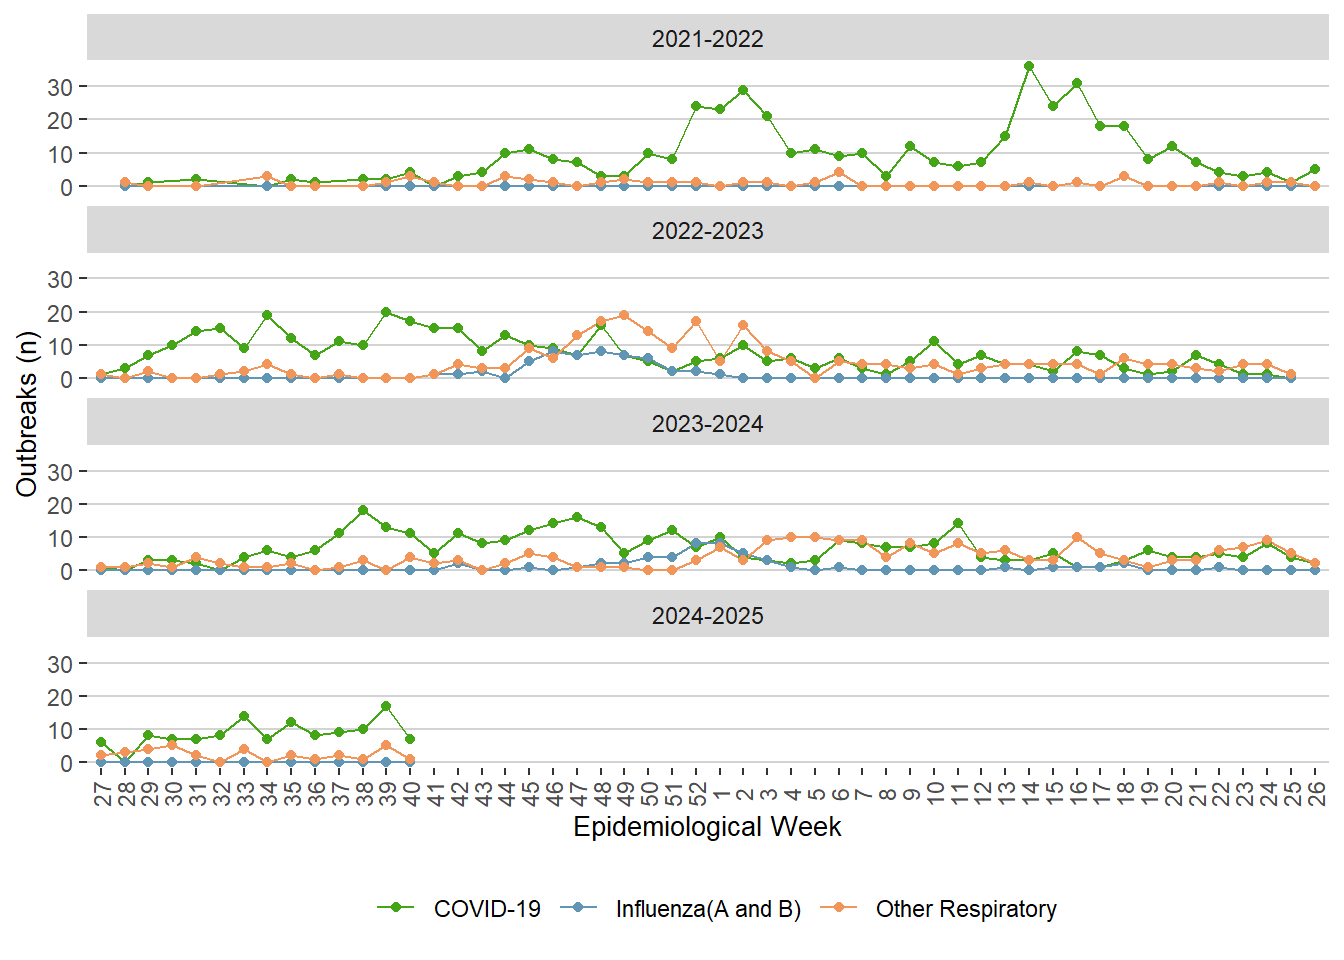
Figure 8. Weekly Respiratory Outbreaks, Manitoba, 2021 – October 5, 2024
Vaccinations
Table 2. Coverage of Influenza Vaccinations, Manitoba
| Age group | Number Vaccinated | %Coverage | Number Vaccinated | %Coverage |
|---|---|---|---|---|
| 0-4 | 17517 | 21.0% | 14893 | 17.8% |
| 5-17 | 37358 | 15.7% | 32418 | 13.6% |
| 18-49 | 95928 | 15.4% | 91109 | 14.6% |
| 50-64 | 83205 | 32.3% | 78968 | 30.6% |
| 65+ | 146416 | 58.9% | 149593 | 60.2% |
| All | 386679 | 26.7% | 379898 | 26.2% |
Note. Actual number of people vaccinated between September 1 and October 5, 2024 may be higher due to delays in reporting doses administered.
FluWatchers
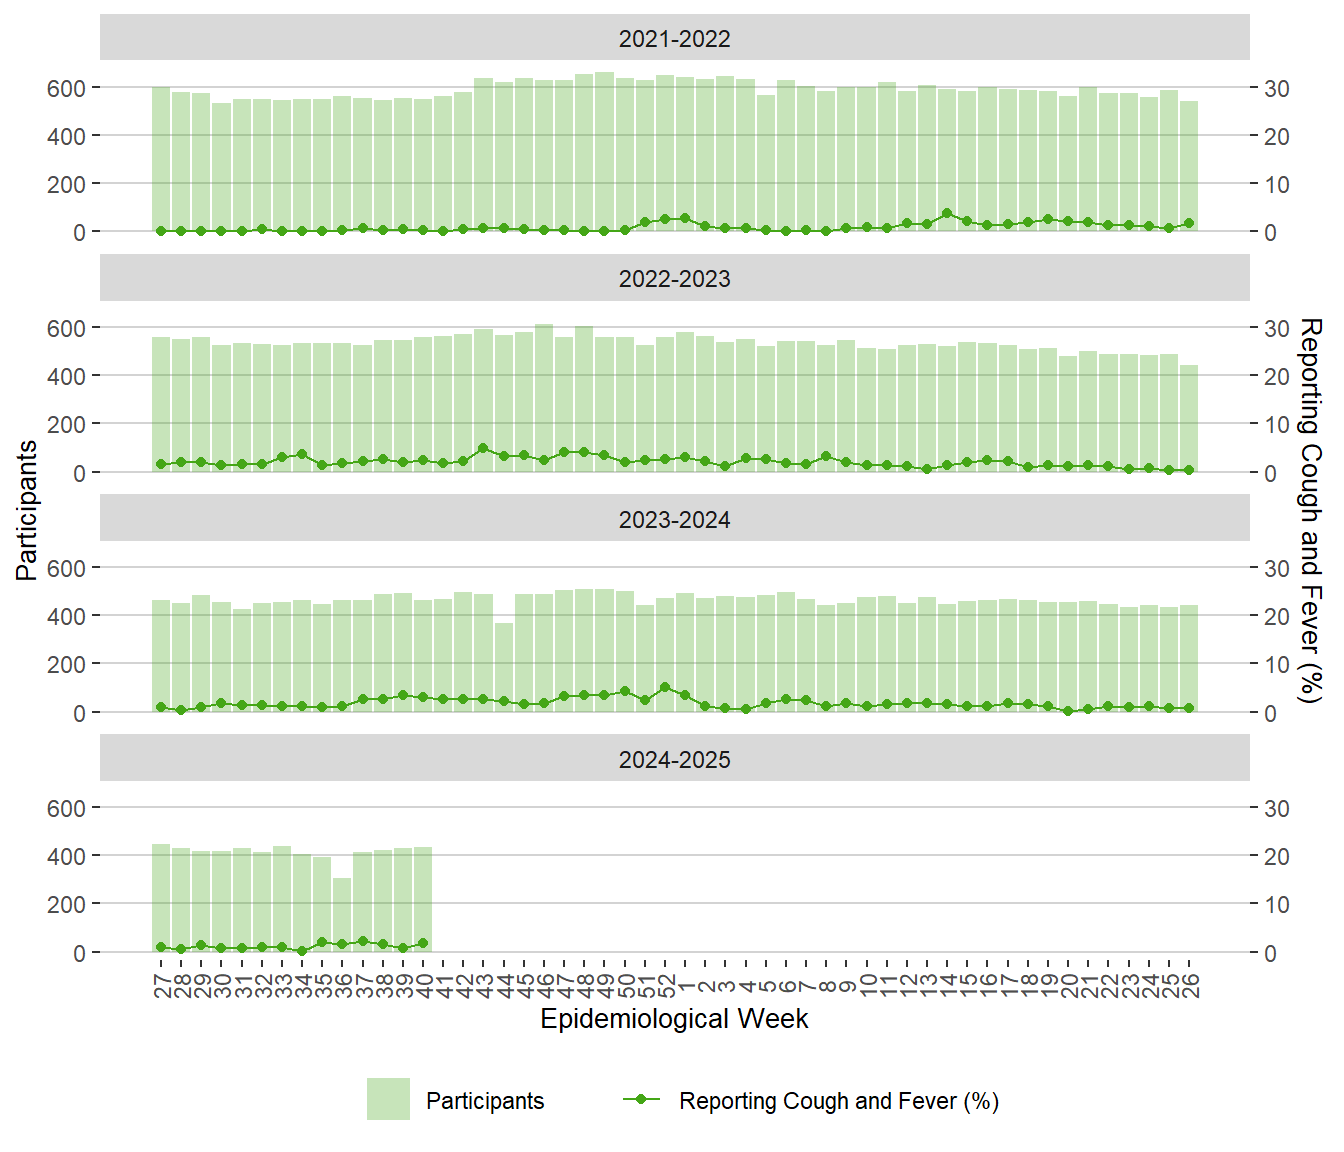
Figure 9. Weekly FluWatchers Participants and Percentage Reporting Fever and Cough, Manitoba, 2020 – October 5, 2024
Physician Visits
Figure 10. Weekly Percentage of ILI Related Visits to Sentinel Physicians, Manitoba, 2018 – October 5, 2024
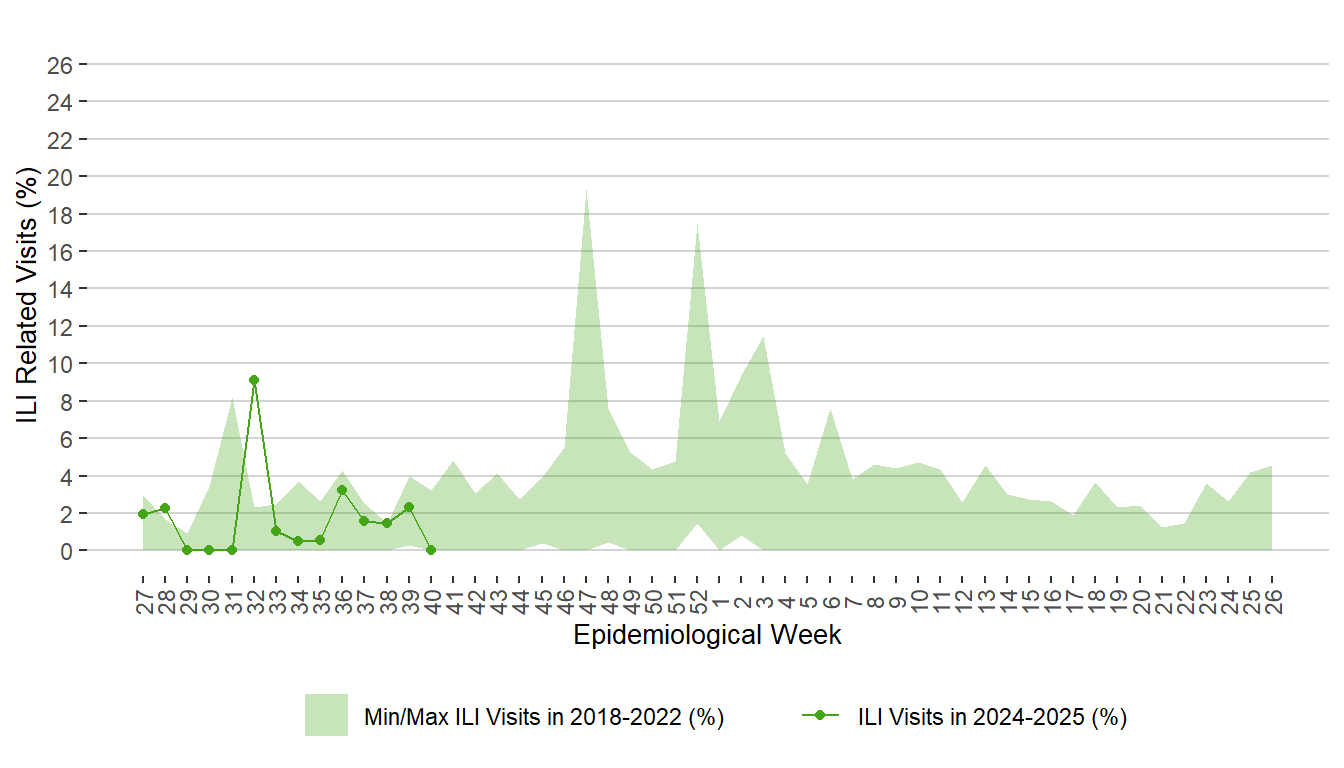
Note. Due to small numbers the rates should be interpreted with caution.
Antiviral
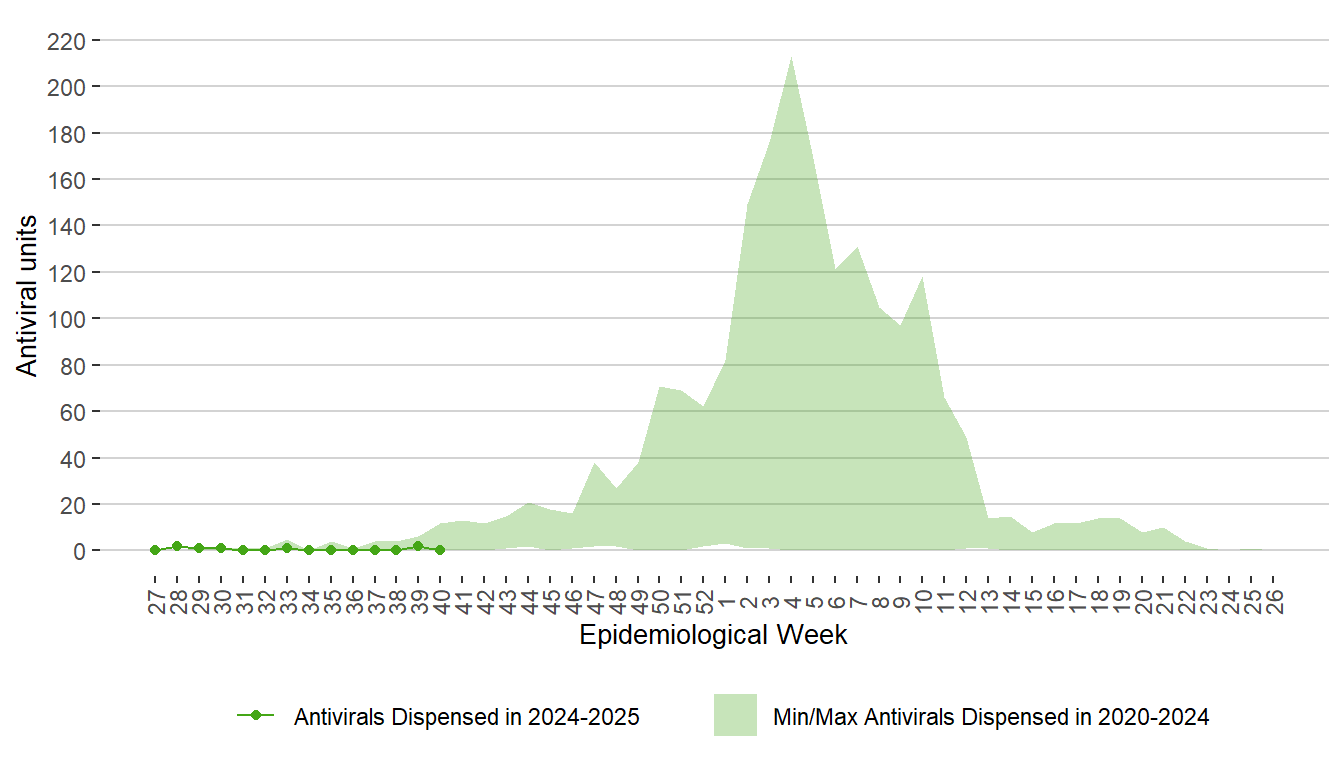
Figure 11. Weekly Units of Antiviral Dispensed from Pharmacies, Manitoba, 2020 – October 5, 2024
ED Visits
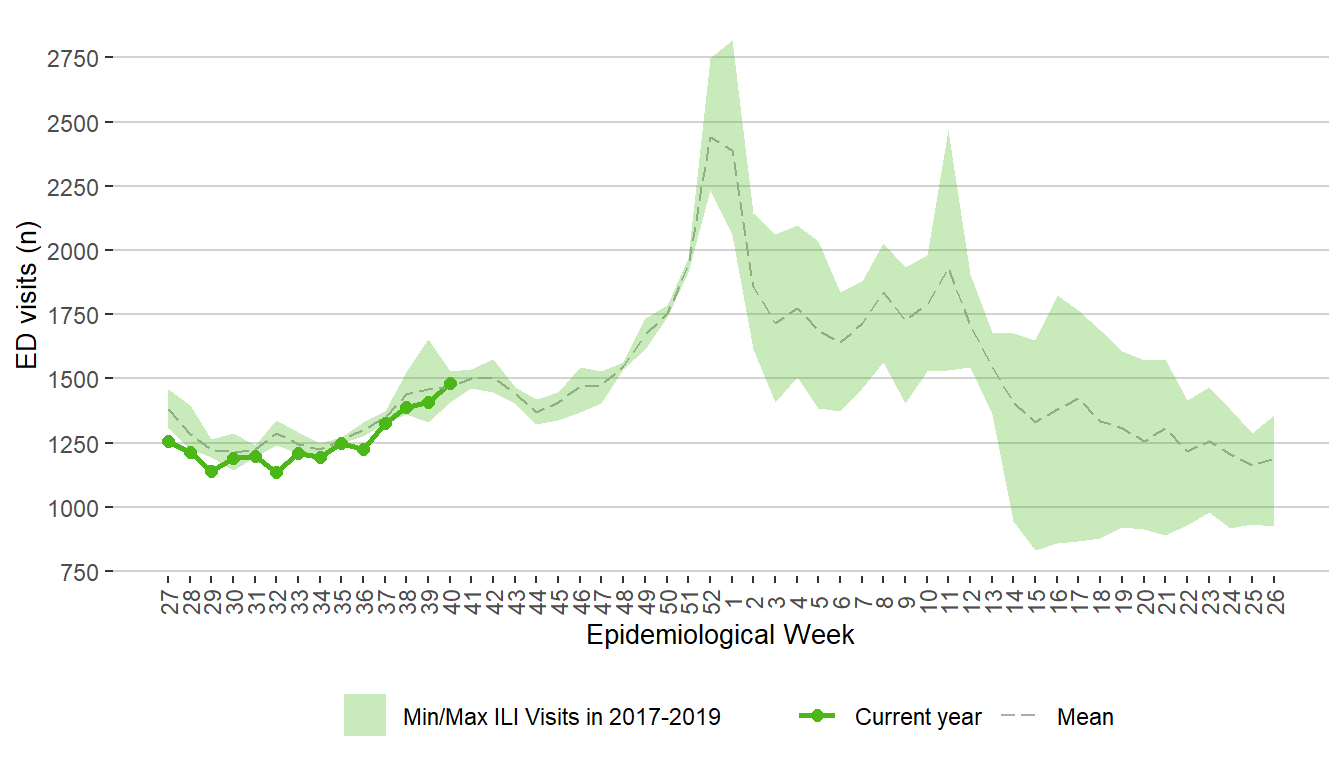
Figure 12. Weekly Respiratory Visits to Emergency Department, Manitoba, 2017 – October 5, 2024
