
Epidemiology and Surveillance - epiSUMMARY February, 2020 SUMMARY
Laboratory-confirmed cases of Chlamydia infections
This report includes all laboratory-positive and confirmed cases of chlamydia infections reported in Manitoba to the Epidemiology and Surveillance Unit.
For a case to be counted as a confirmed case of chlamydia infection, it must meet the provincial surveillance case definition as outlined in the Provincial Communicable Disease Management Protocol. Multiple infections of chlamydia are determined as those occurring 35 days apart unless otherwise stated in investigation forms.
Cases that have not been assigned to a specific health region are grouped as "Other" assigned health region category.
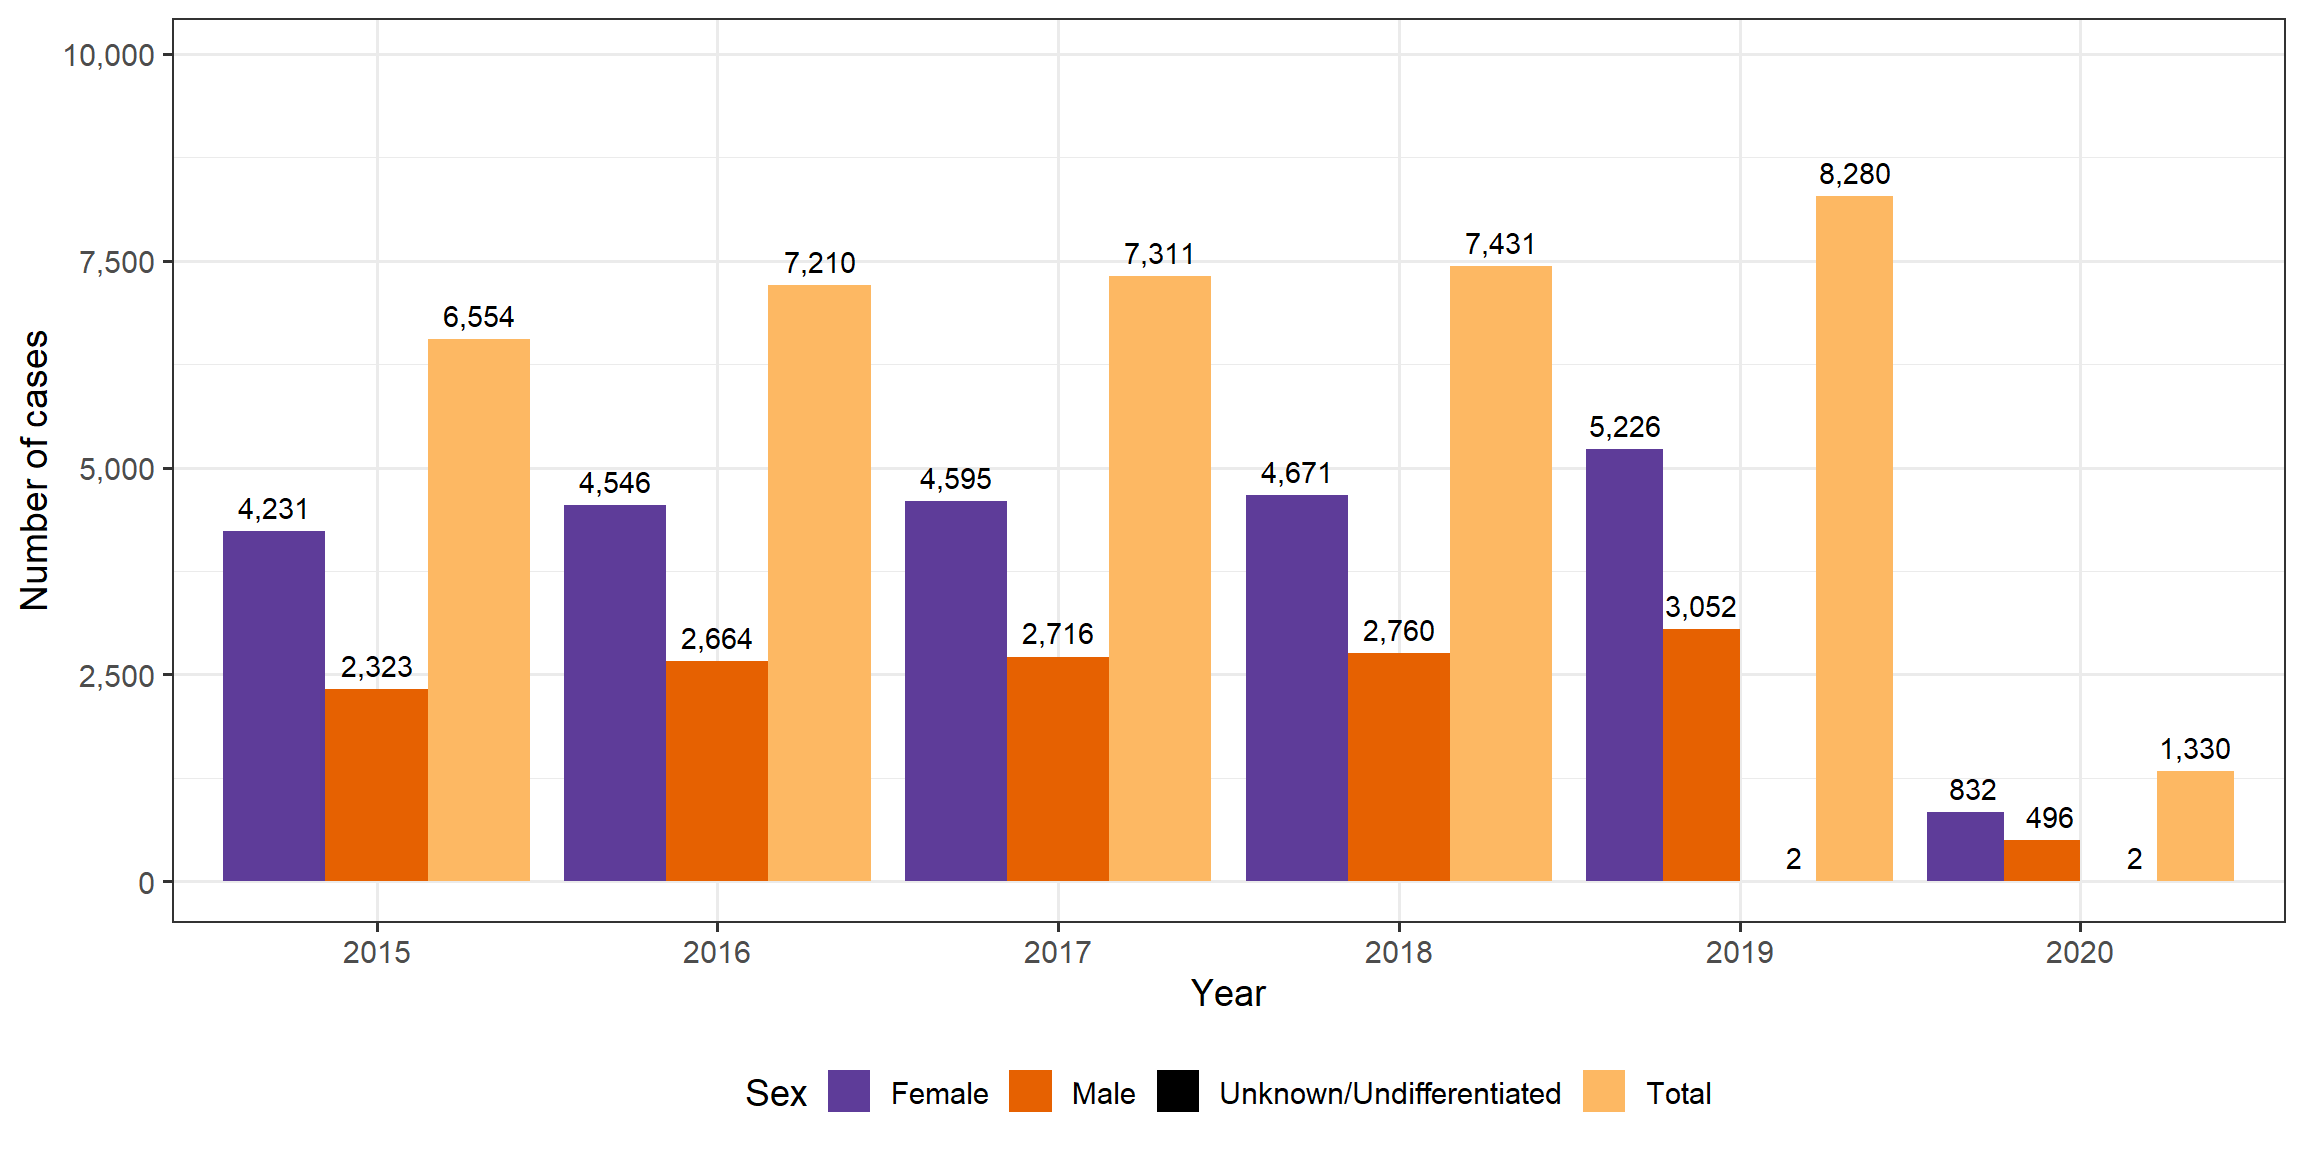
Number of laboratory-confirmed cases of Chlamydia infections per year in Manitoba,
January 01, 2015 to February 29, 2020.
Number of laboratory-confirmed cases of Chlamydia infections per month in Manitoba,
January 01, 2015 to February 29, 2020.
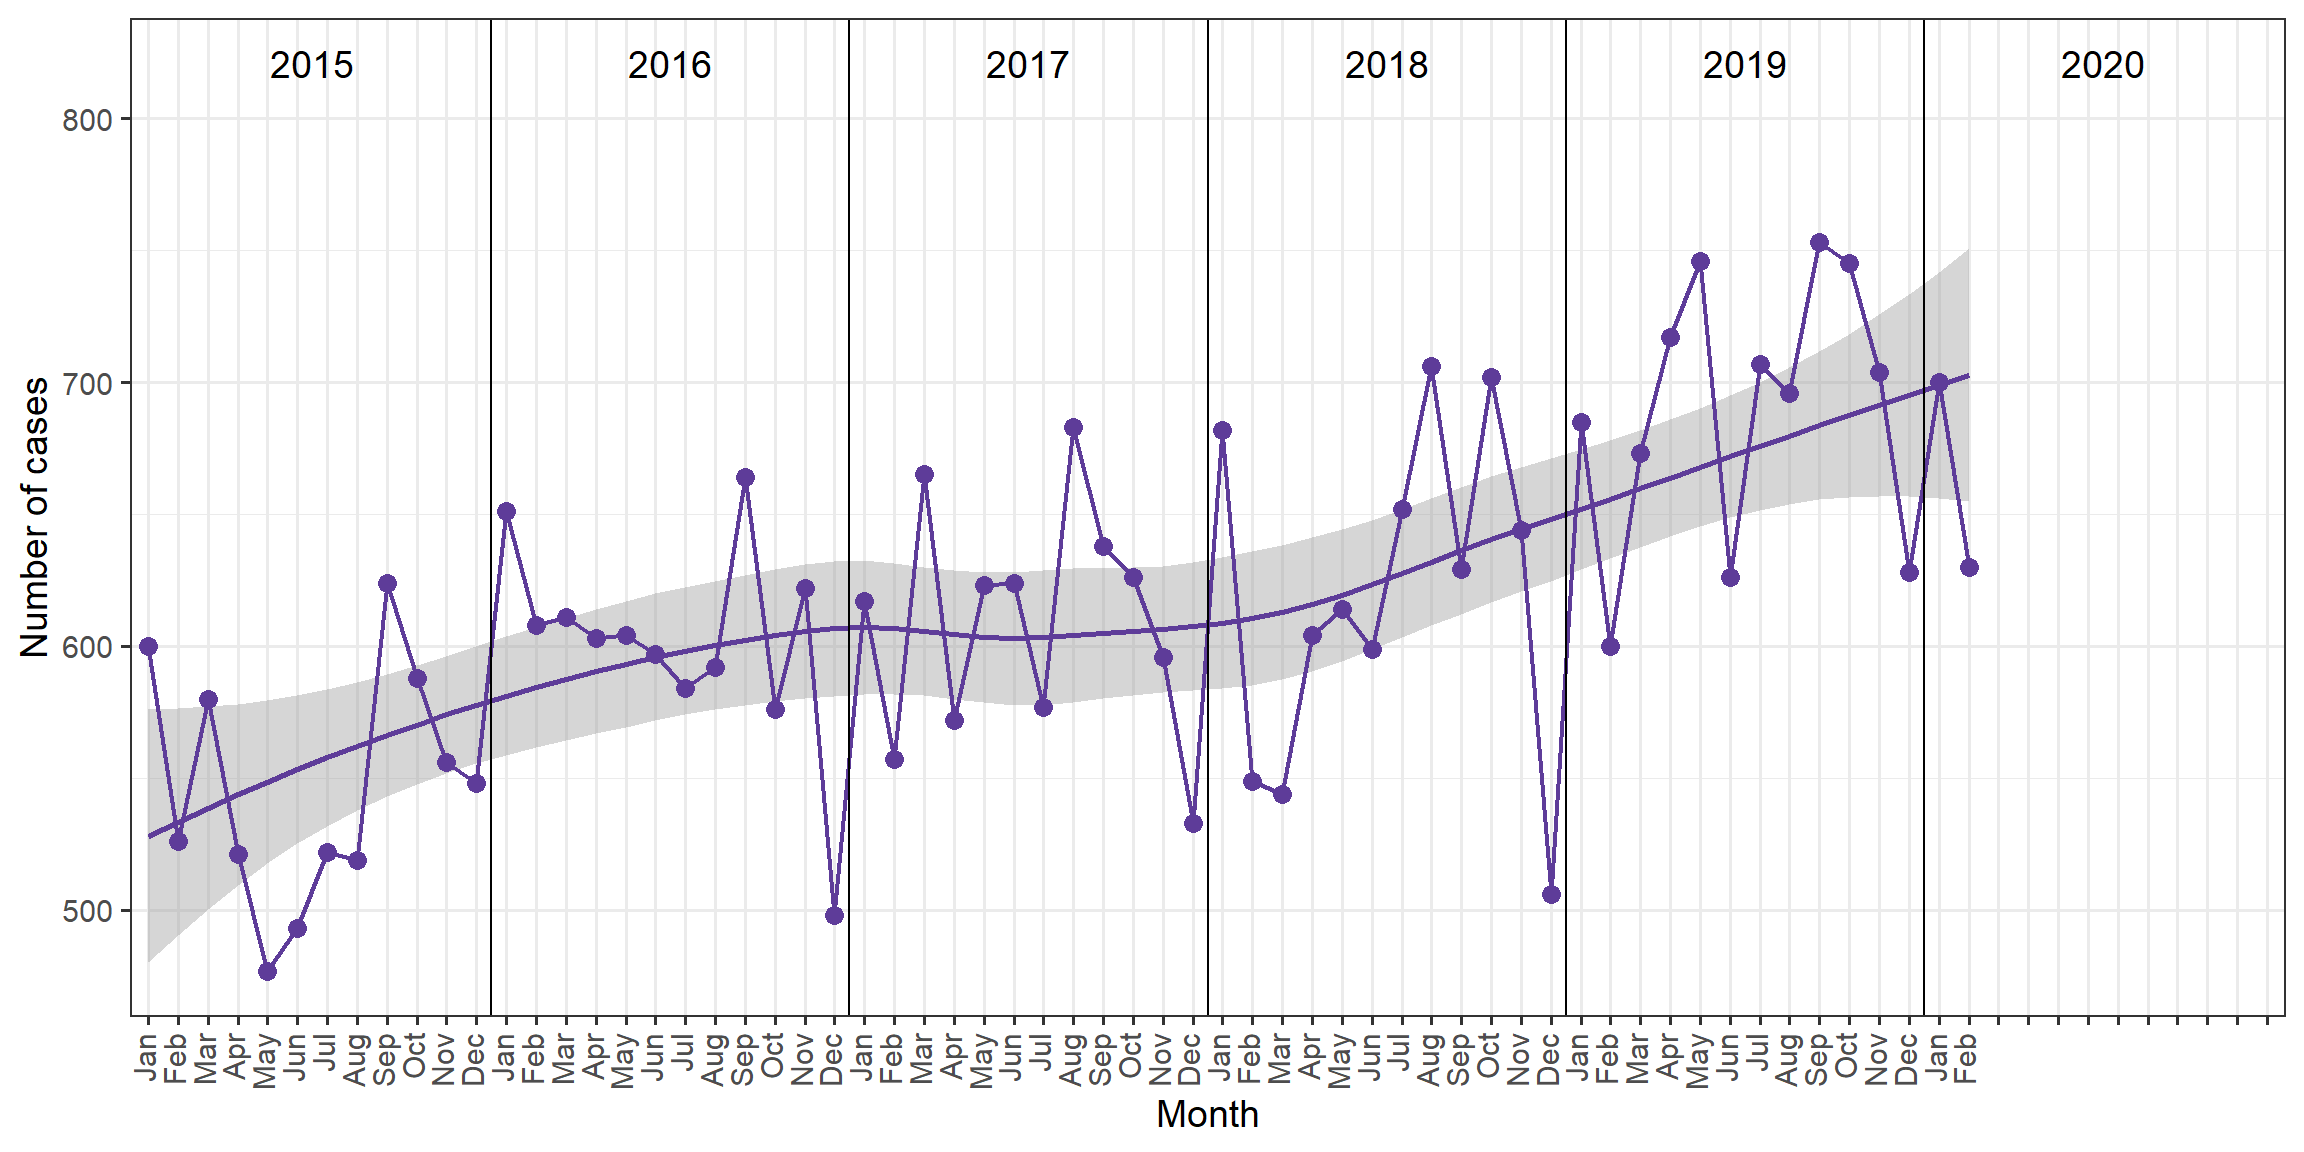
In this graph, the monthly number of laboratory-confirmed cases of Chlamydia infections is presented as purple dots connected by lines. Monthly number of cases may be subject to large variations, which may make it difficult to spot trends in the data. For this reason, we also present a smoothed curve (solid purple line) for this data where the shaded area represents the 95% confidence interval generated from the smoothing procedure. The smoothed curve should unveil potential trends in the data presented.
Number of laboratory-confirmed cases of Chlamydia infections per month and by sex in Manitoba,
January 01, 2015 to February 29, 2020.
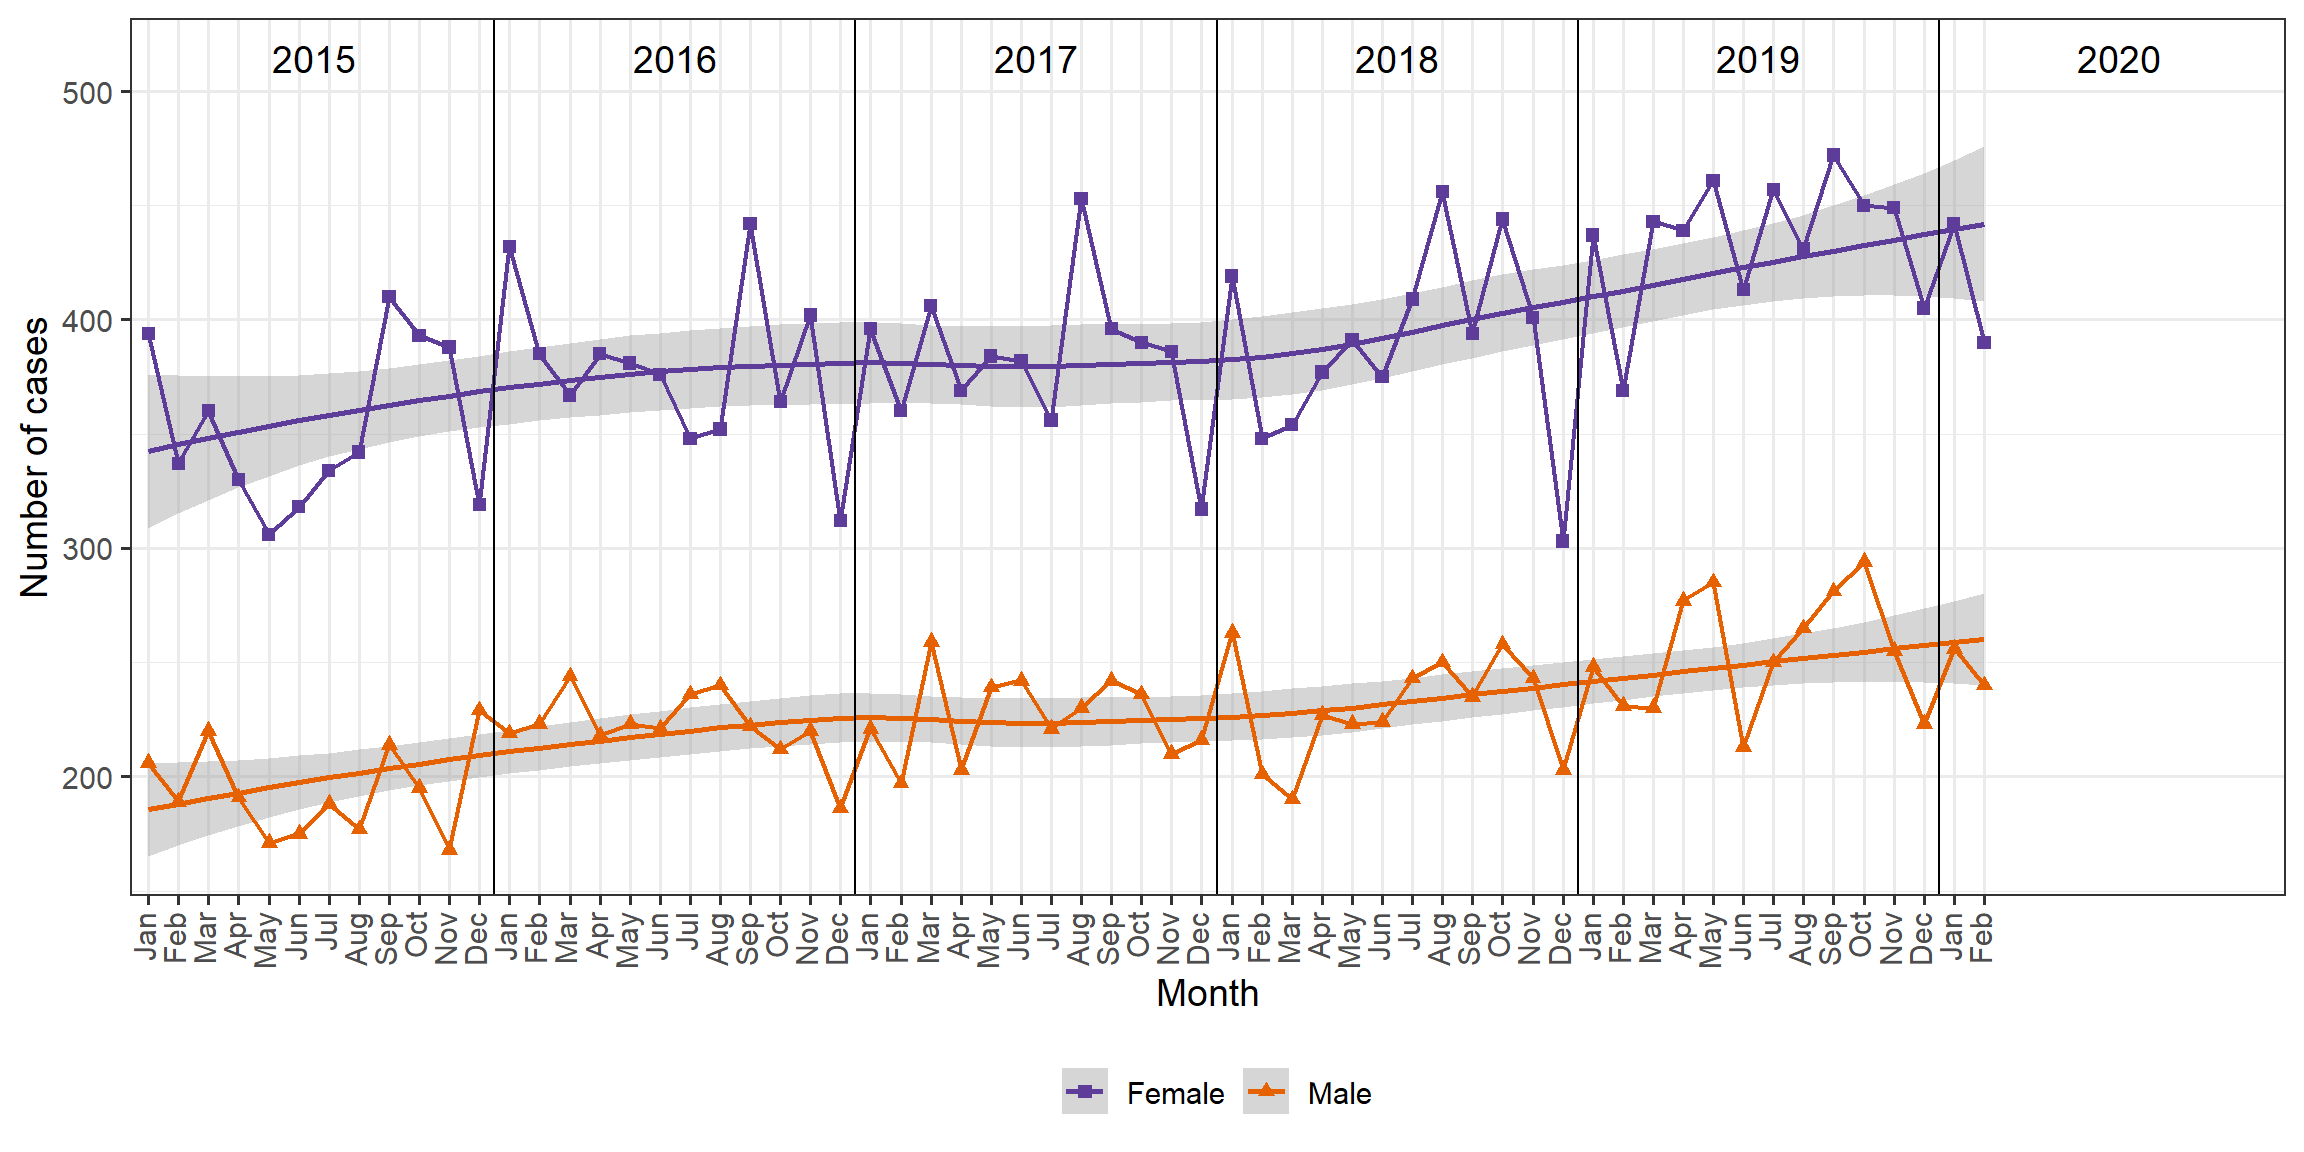
Similarly to the previous graph, the monthly number of laboratory-confirmed cases of Chlamydia infections by sex is presented as purple squares for females, and orange triangles for males, both connected by lines with the corresponding color. Monthly number of cases may be subject to large variations, which may make it difficult to spot trends in the data. For this reason, we also present a smoothed curve for each data set along with their corresponding 95% confidence interval — as generated from the smoothing procedure — as a shaded area. Smoothed curves should help unveil potential trends in the data presented.
NOTE: This graph excludes cases where sex is unknown, if any. These cases will be included as data quality checks are performed and sex is identified.
Crude rates of laboratory-confirmed cases of Chlamydia infections in Manitoba per 100,000 Manitobans per year and by sex, January 01, 2015 to December 31, 2019.
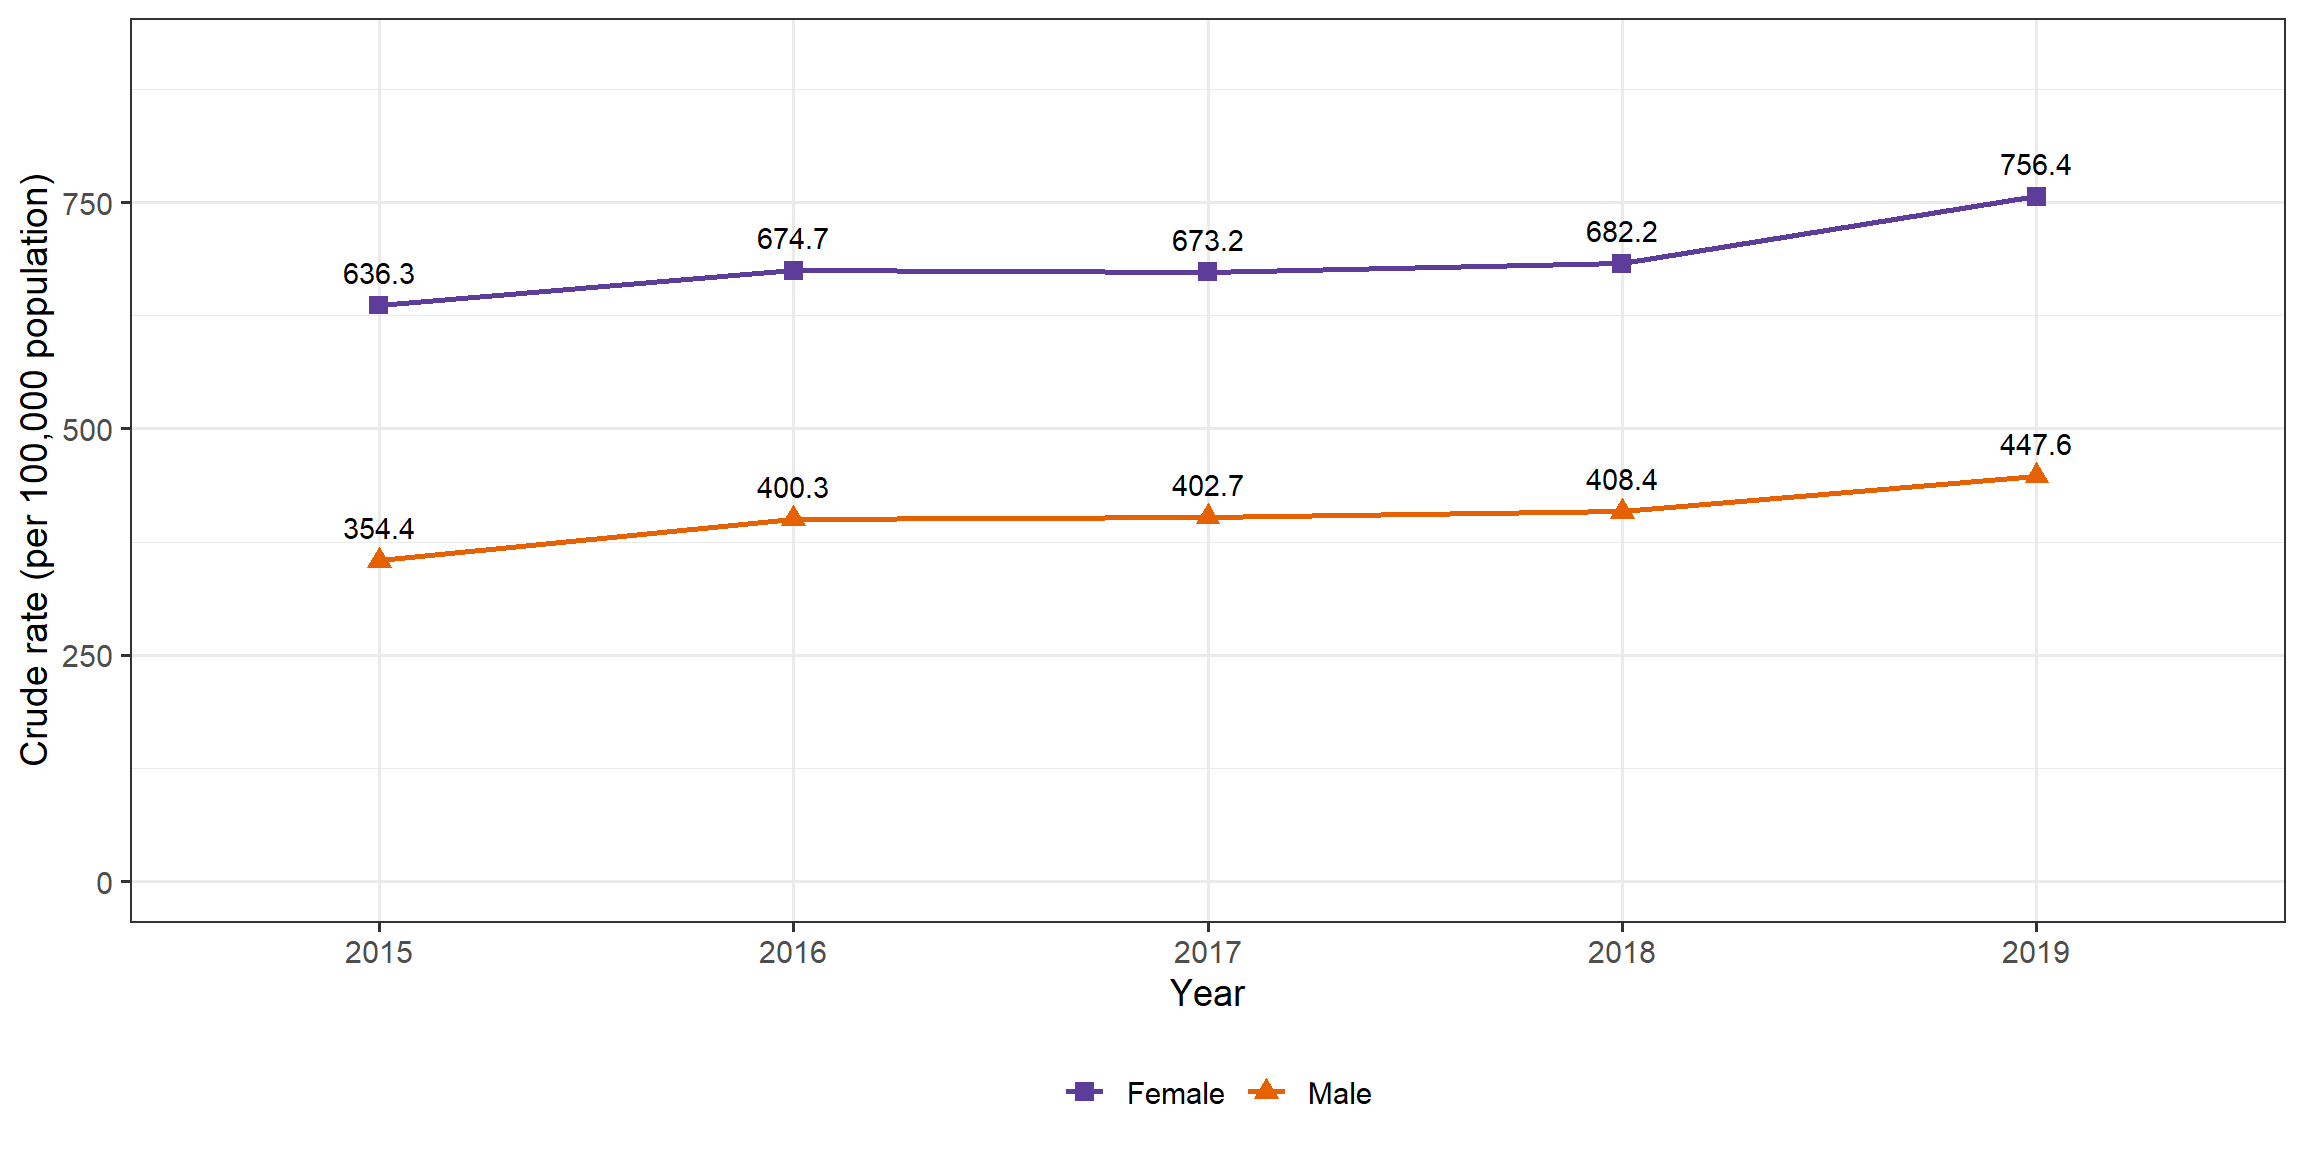
NOTE: This graph excludes cases where sex is unknown, if any. These cases will be included as data quality checks are performed and sex is identified.
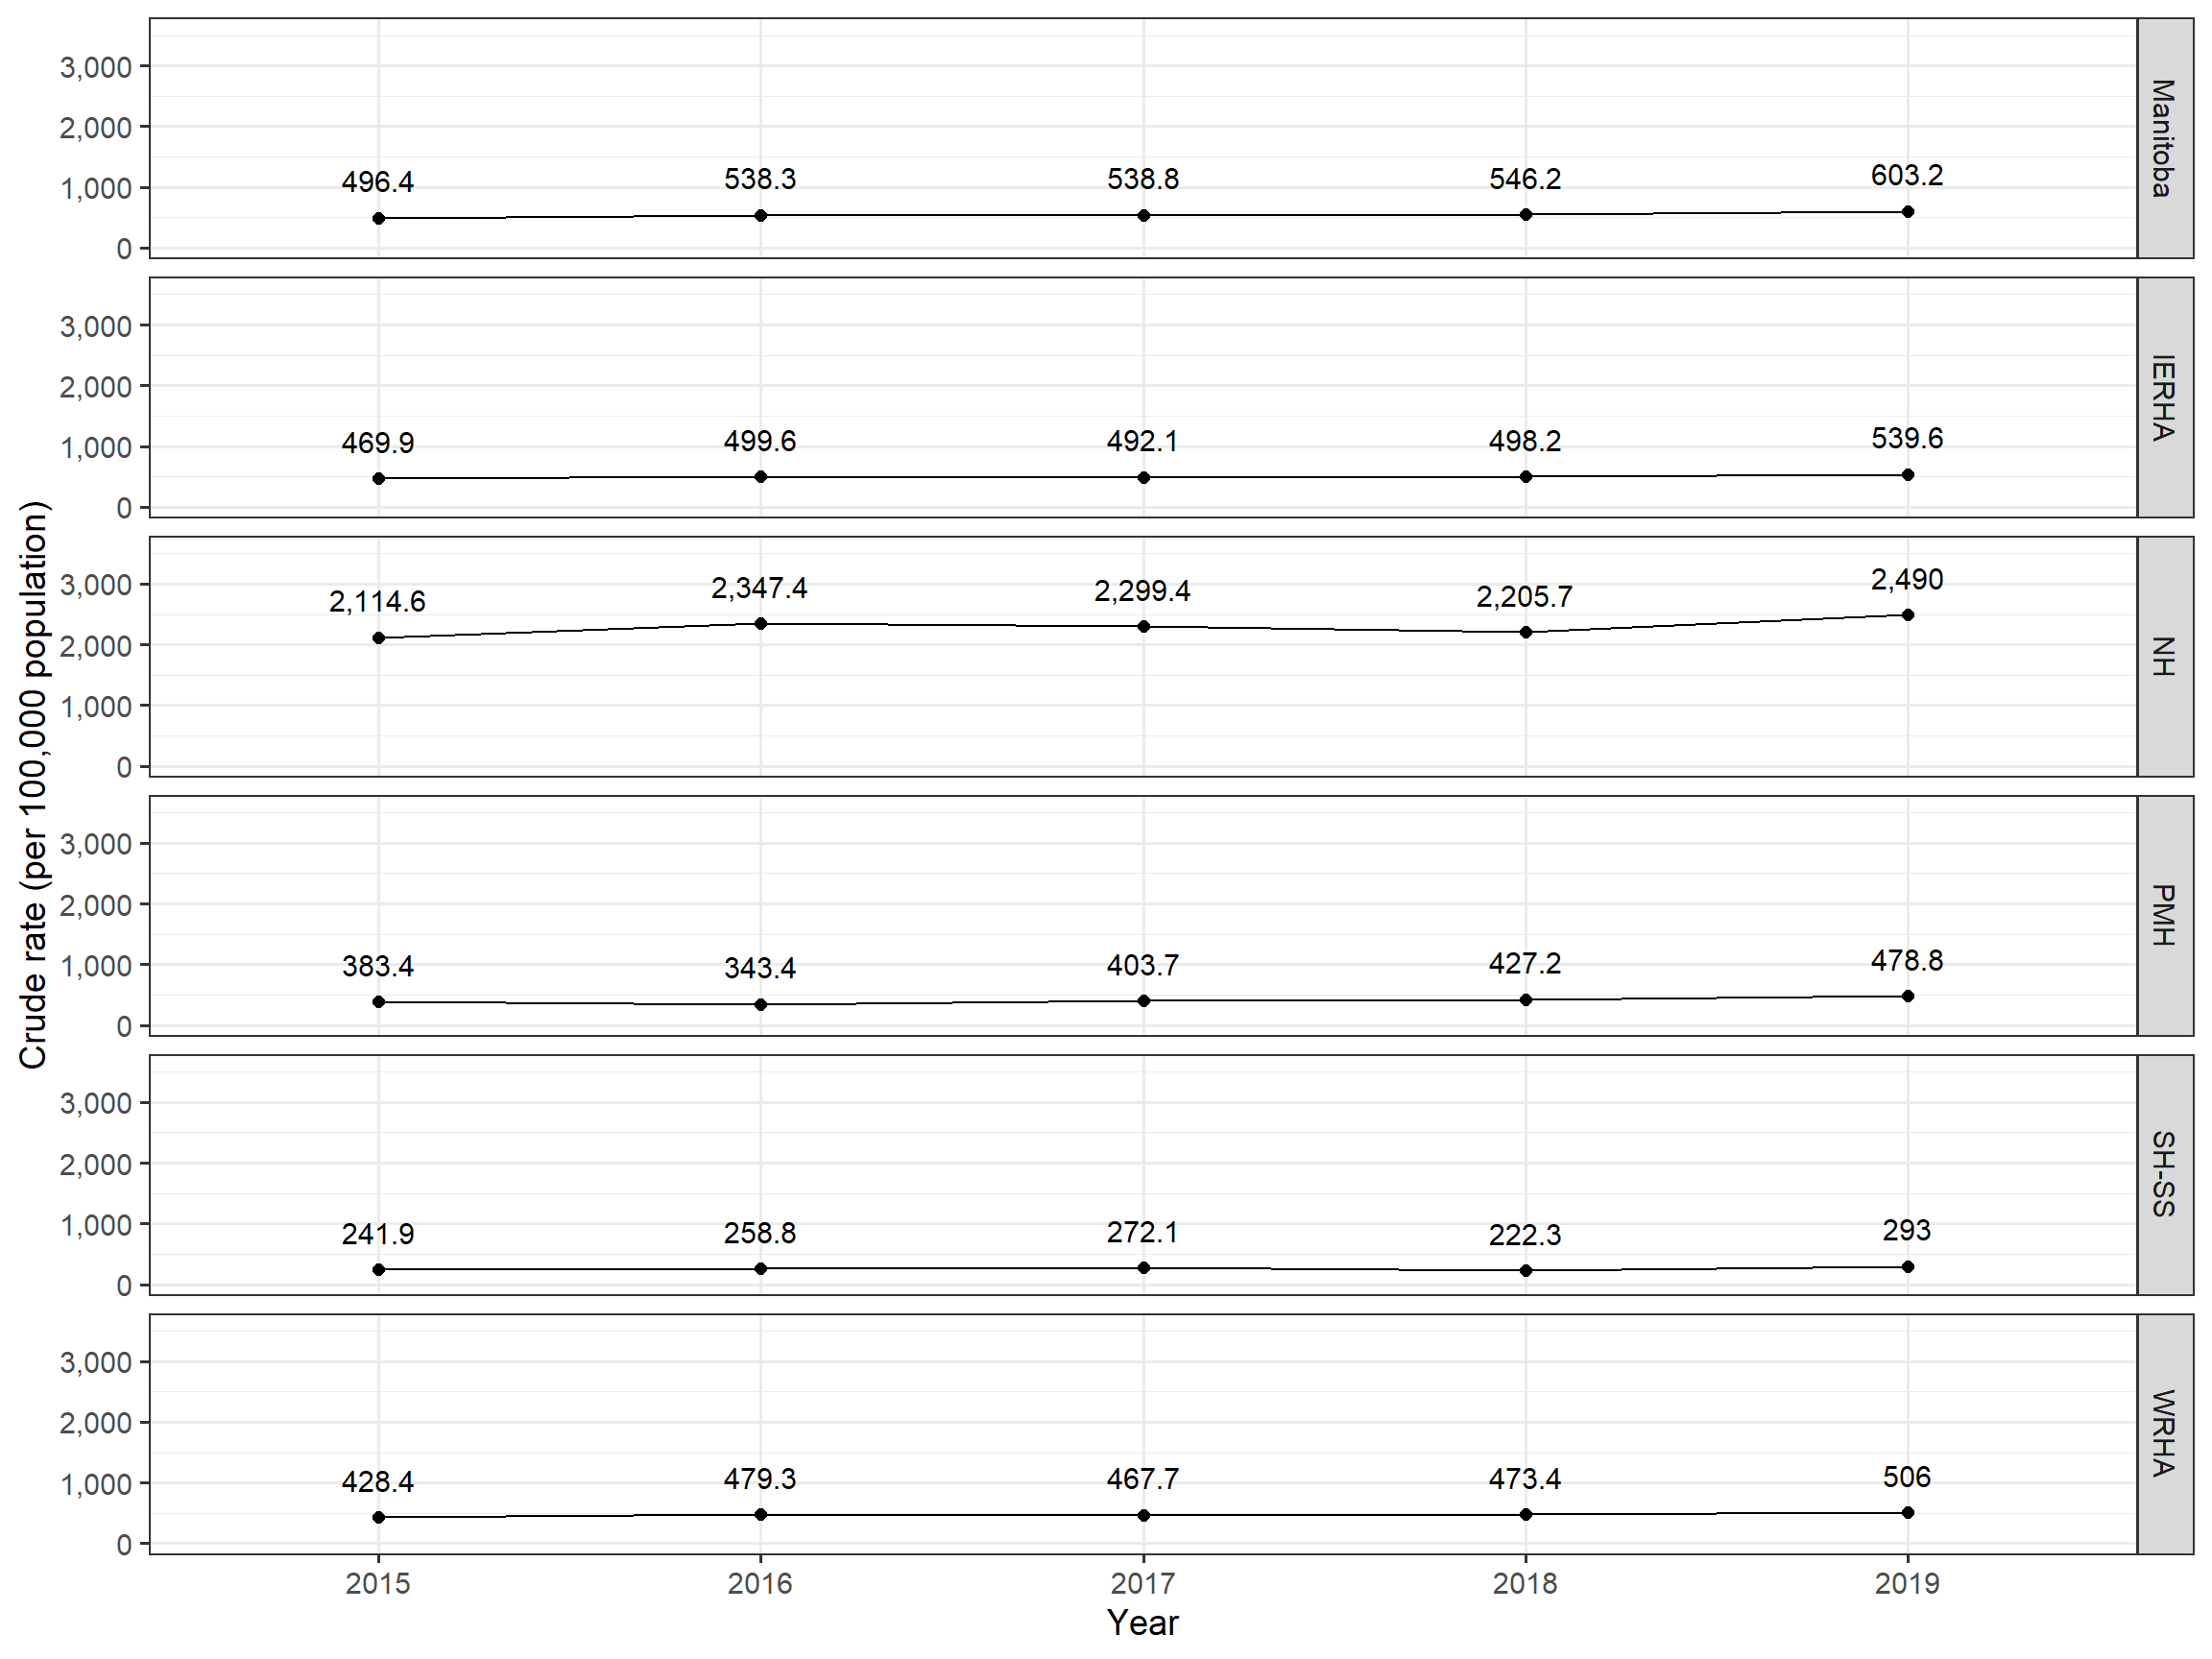
Crude rates of laboratory-confirmed cases of Chlamydia infections in Manitoba per 100,000 Manitobans
per year and by Health Region, January 01, 2015 to December 31, 2019.
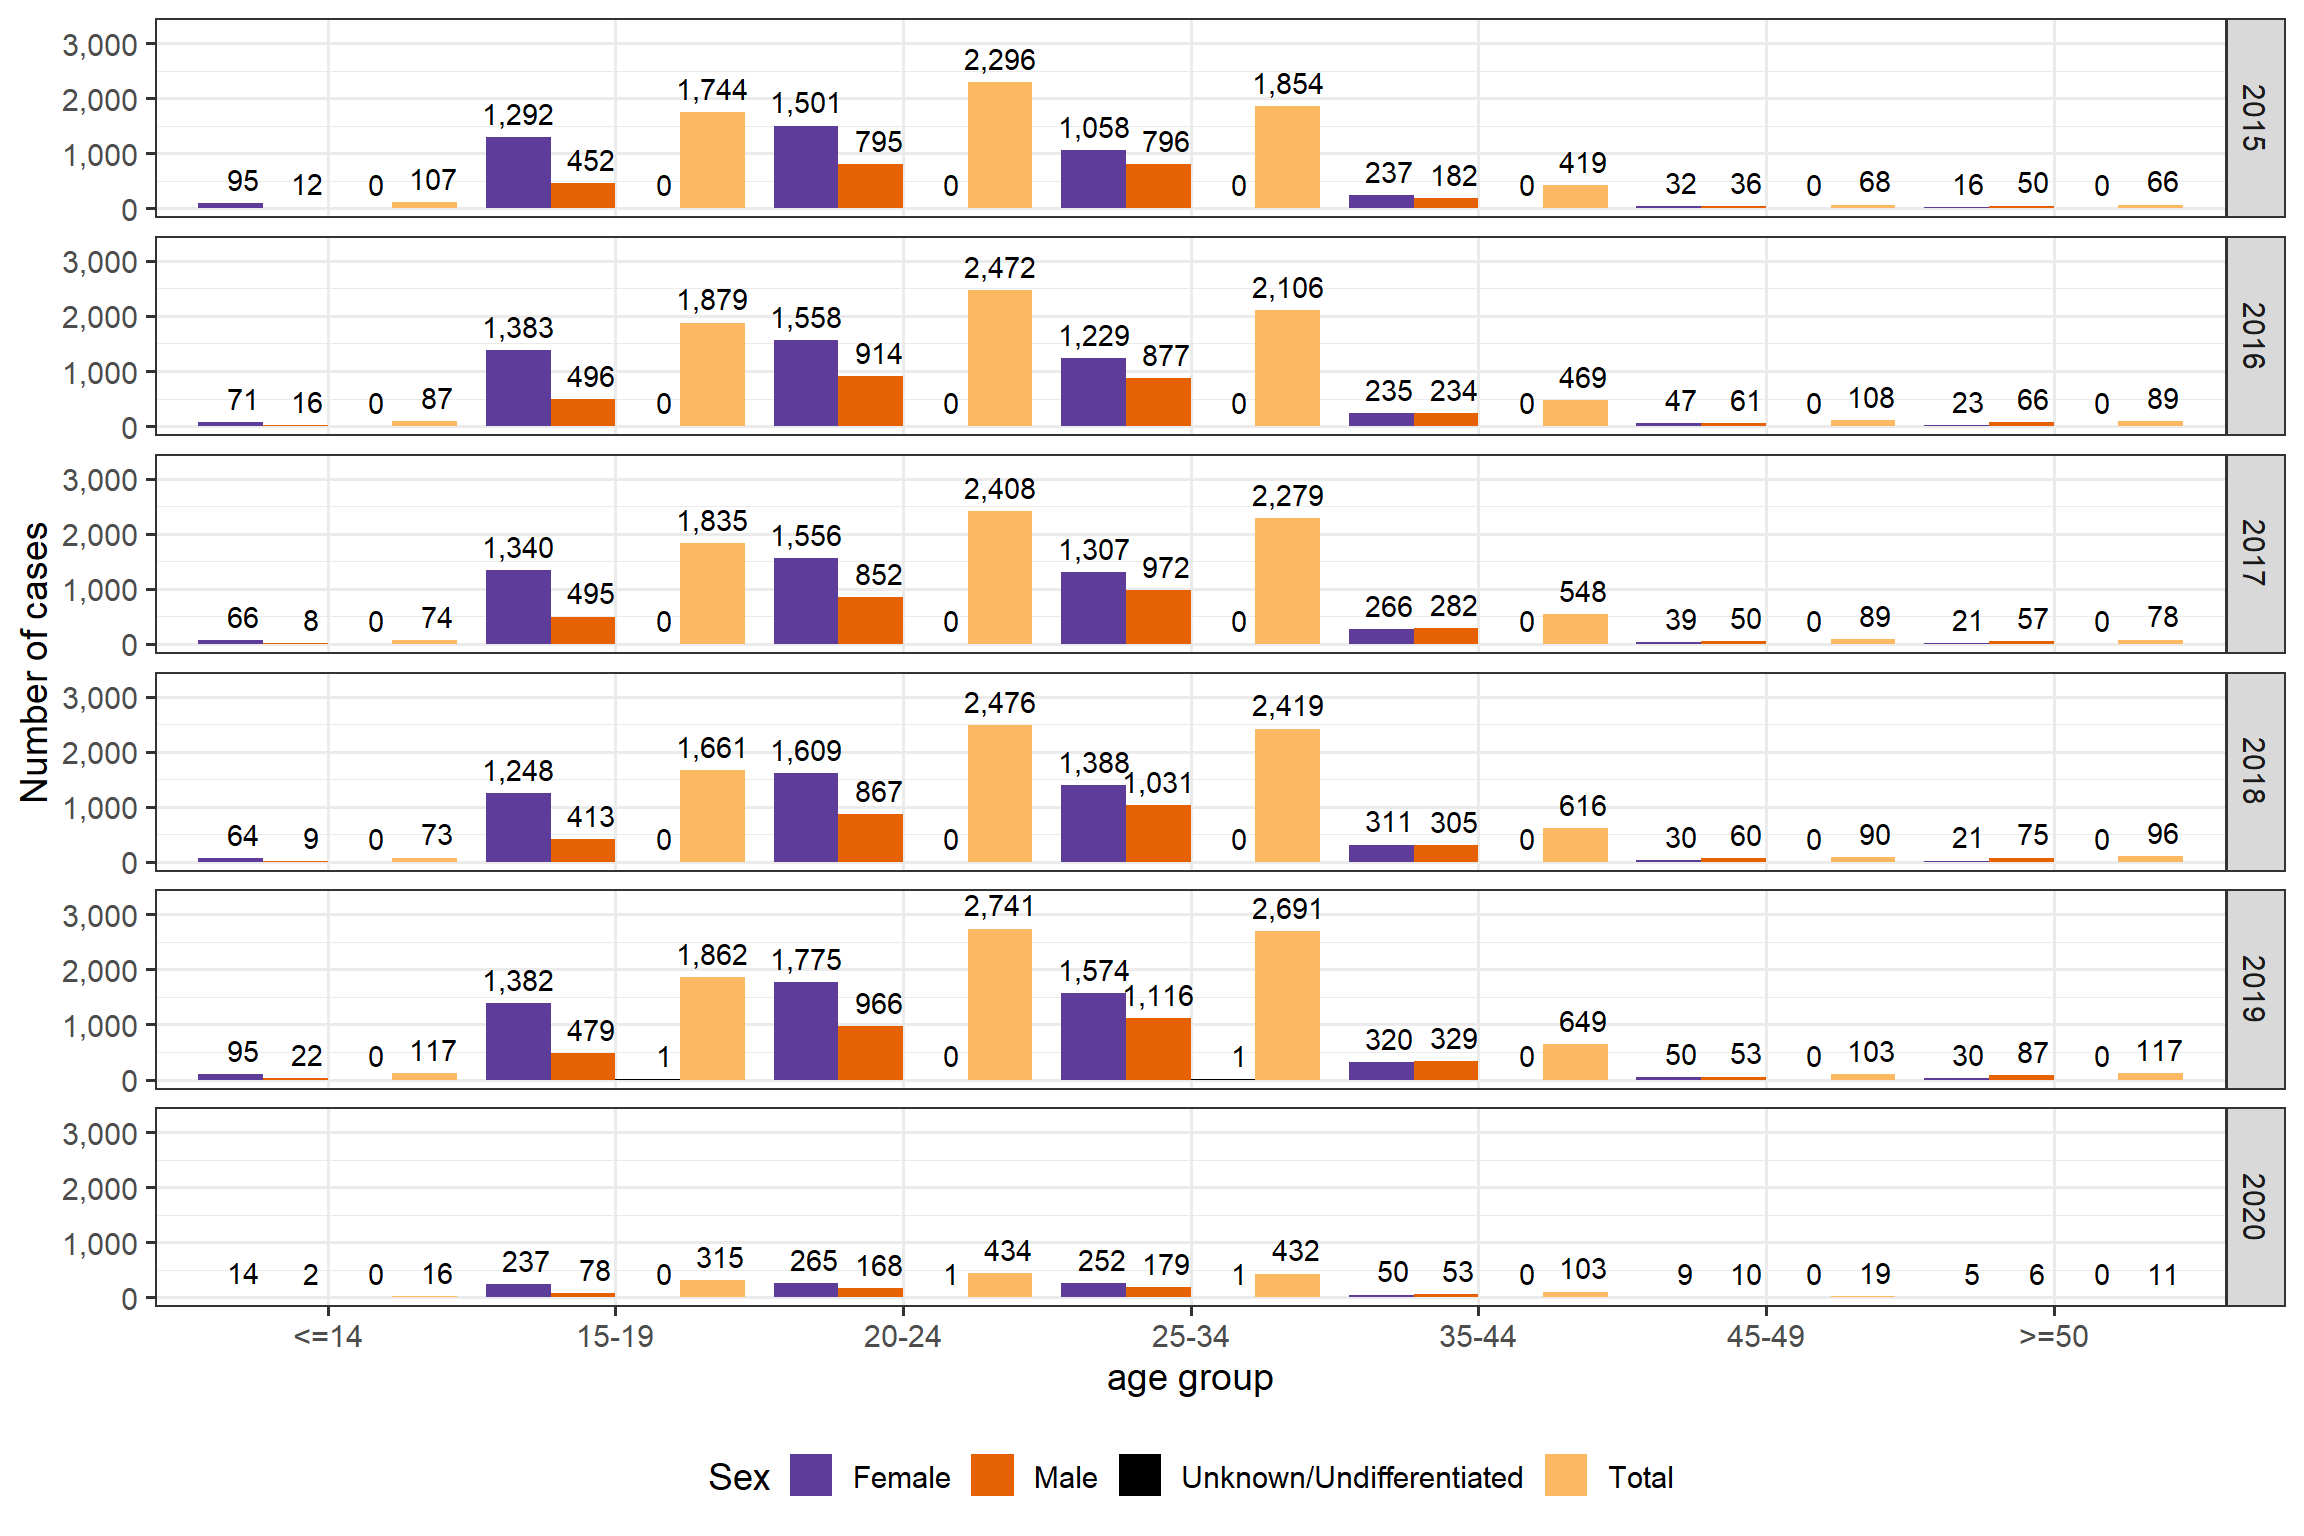
Yearly number of laboratory-confirmed cases of Chlamydia infections in Manitoba by age-group and
by sex, January 01, 2015 to February 29, 2020.
^ back to top
Glossary
Health Regions
| WRHA | Winnipeg Regional Health Authority |
| SH-SS | Southern Health - Santé Sud |
| NH | Northern Health |
| IERHA | Interlake-Eastern Regional Health Authority |
| PMH | Prairie Mountain Health |
| Other | Used for cases that have not been assigned to a specific organization. |
Abbreviations/Definitions
| RHA | Health region according to address at time of case |
| IQR | Interquartile range, which provides a sense of where the bulk of the values in the data set lie. |
| GC | Gonorrhea |
| CT | Chlamydia |
| COI | Gonorrhea-Chlamydia Co-Infection |
^ back to top
|
Manitoba Health, Seniors and Active Living |