
GIS Map Gallery Geographic Information System
|
M/Ms – glaciomarine sand, silt, and clay
Raised shorelines (Image 21, Image 22, and Image 23) and peat-bearing wetlands (Image 24) dominate the Hudson Bay Lowland (Unit M/Ms). The Hudson Bay shore area is currently rising at a rate of approximately one metre per century, and has been rising since the glaciers melted almost 8000 years ago, resulting in an abundance of raised shorelines (Unit Ms; see ‘Isostatic rebound’ section in the notes above and ‘Isostatic rebound - Tyrrell Sea’ to the right). Primarily because of isostatic rebound, numerous large rivers in the Hudson Bay Lowland have cut deeply into the underlying sediments, exposing glacial till and associated sediments that represent multiple glaciations (Image 25). Source: Image 21, http://geoinfo.amu.edu.pl/wpk/geos/geo_6/geo_plate_c-24.html [May 2007]; Image 22, Google Earth, June 2007.
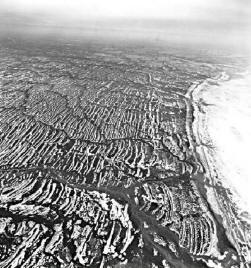 Image 21
|
 Image 22 |
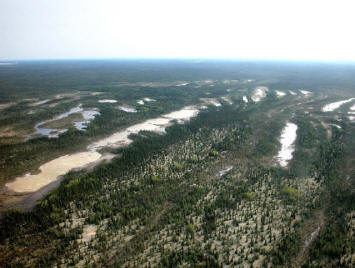 Image 23
|
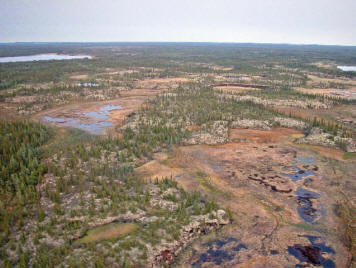 Image 24 |
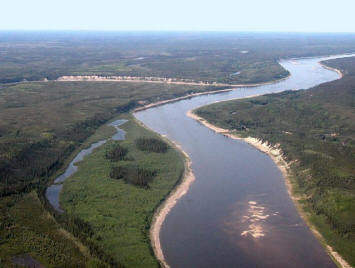 Image 25 |
 Back to Surficial Geology Compilation Map Series of Manitoba (SGCMS)