
Informational Notices:
Vegetation and Soil Monitoring Study in the Vicinity of 8-8 Battery
Tilston, Manitoba 1999
Floyd Phillips
Vicki Henderson
Terrestrial Quality Management Section
Manitoba Conservation
Manitoba Conservation Report 2000-05
September 2000
Executive Summary
The Tilston area is the site of oil extraction from underground reserves in the southwest corner of Manitoba. A vegetation and soil monitoring study was carried out during the summer of 1999 in response to concerns of rural residents near the 8-8 oil processing battery (SE8-6-29). The objective of the study was to determine if there were any observable effects caused by the sulphur compounds present in the air emissions from the battery.
Ten monitoring sites were selected, 5 along each of two 2 km transects running SE and W of the battery. Aspen leaves were collected from each of the sites in May, July and August, and soil samples were collected in July. Aspen leaves were analyzed for sulphur and soil samples were analyzed for sulphur and sulphate. The condition of plant leaves was observed several times during the summer, at the monitoring stations, at the aspen bluffs close to the battery, and at farmyards within 2.5 km of the battery. Samples of unhealthy or injured leaves were collected and sent to the Crop Diagnostic Centre, Manitoba Agriculture where plant pathologists diagnosed the cause.
Although many plants in the study area and the control farm showed injury symptoms, disease (mostly fungus) or insects caused them all. There was no visible SO2 injury to plants in the study area. The relatively high incidence of fungal infection and other plant diseases was probably aproduct of the abnormally wet conditions during the spring and summer of 1999.
The sulphur content of aspen leaves suggested that there may have been some effect from the battery emissions at one close-in site, although the data were too variable to reach a definitive conclusion.
Available sulphate in the surface soil was slightly elevated at locations within 500m of the 8-8 battery, but due to the high variability, there was no conclusive evidence that emissions of sulphur compounds may have been a contributing factor. Total sulphur in the soil was also variable but there was no pattern that suggested that this parameter might have been affected by sulphur compounds emitted from the 8-8 oil processing battery.
In summary, emissions of sulphur compounds in the study area did not injure vegetation. There was no conclusive evidence that sulphur compounds in the air of the study area affected sulphur levels in aspen leaves or sulphate or sulphur in the soil. The levels of sulphur found in the aspen leaves were within the normal range and would not be detrimental to plant health. The sulphate levels in the soil were lower than or in the low part of the range reported in the Soil Survey Report for the area.
Acknowledgments
The authors wish to thank the local residents of the study area for their cooperation in providing access to their property and for agreeing to allow the sampling of soils and vegetation. The authors also acknowledge the assistance of Mr. D. Bezak who provided comments on an earlier draft of the report and Mr. G. Jones for preparing the figure showing the study area.
Introduction and Background
Oil reserves are present in the southwest corner of Manitoba, and oil extraction has been occurring in the Tilston area since the early 1950s.
The Terrestrial Quality Section of Manitoba Conservation conducted a vegetation and soil monitoring program in the vicinity of the 8-8 oil processing battery during the summer of 1999. The 8-8 battery is located north of Tilston, in the southeast quarter of Section 8 Township 6 Range 29. This is one of the larger processing batteries in the area and has operated since 1985. Rural residents living within a few kilometres of the 8-8 battery have complained about odours and are concerned that air pollutants may be causing health effects to both humans and livestock.
The product pumped from the oil wells in the area is approximately 10 percent oil and 90 percent salt water. The oil contains solution gases, including hydrocarbon components of natural gas and hydrogen sulphide (H2S). Oil processing batteries perform two initial treating steps: (i) separation of the crude oil from the salt water during which some of the solution gases are released, and (ii) heating the oil to drive off more of the solution gases. Some of the solution gases is burned as fuel in the oil treater, and the past practice, was to direct the excess gas to a flare stack where it was partially burned. A more recent technology used at Tundra’s 8-8 battery since November 1999, is to burn the excess gas in an incinerator to effect more complete combustion. Since the combustion of H2S produces sulphur dioxide (SO2), the air emissions from a processing battery can contain both H2S and SO2.
Although air quality monitoring was being conducted at two fixed locations, plus some spot monitoring with a portable monitor, there was interest in using other monitoring tools to provide further information about the levels of sulphur gases and their distribution in the area. If the sulphur dioxide dose (concentration x duration) is high enough it can cause visible injury symptoms to the leaves of susceptible plants or to the needles of conifers. Plants, including some that are native to the area (e.g. aspen, rose, wild pea), are susceptible to SO2 injury. There is a potential that these plants may be injured if doses are above a critical minimum. Dreisinger and McGovern (1970) reported injury to aspen leaves after a one hour exposure to 0.42 ppm SO2, but usually did not observe damage until exposures were in the range of 0.95 ppm for one hour. If the relative humidity is high, SO2 exposures that may cause acute damage are typically lower, for instance in the 70 ppm range (Dreisinger and McGovern, 1970). Acute SO2 damage (brown tissue) typically occurs on the leaf margins and between the veins of the leaves in broad leaf plants and on the tips of needles in conifer trees.
The purpose of this study was to determine if sulphur compounds, released into the air from oil processing at the 8-8 battery, were affecting local vegetation or soils. The study was conducted during the 1999 growing season and had the following objectives:
- examine plants in the vicinity of 8-8 battery for visible signs of leaf injury and diagnose the cause;
- determine if there were differences in the concentration of sulphur in the vegetation of the area and if so, was there a pattern that might suggest the likely source of the sulphur; and
- determine if there were differences in the concentration of sulphur in the soil of the area and if so, was there a pattern that might suggest the likely source of the sulphur.
Methods
Vegetation Health
During the course of the study, the leaves of plants were examined to see if there were any visible signs of injury. Native plants including trees, shrubs, and herbaceous species, which grow along the edges of poplar bluffs in the area, were the main focus of this investigation. All poplar bluffs growing within 200m of the 8-8 battery were examined as well as the bluffs selected for soil and vegetation (aspen) sampling. Local species considered to be most susceptible to SO2 injury included members of the pea family, rose family and trembling aspen (Populus tremuloides).
During the summer, several species of trees and shrubs in shelterbelts or gardens at three farmyards within 2.5 km of the battery were periodically examined for leaf or needle injury (Figure 1). On September 1, 1999, trees and shrubs in a farmyard northeast of Sinclair, were examined as a control. If vegetation was injured or appeared to be in poor health, samples were taken, placed in sealed plastic bags, refrigerated, and taken to the Crop Diagnostic Centre, Manitoba Agriculture, for a determination of the cause.
Table 1. Farmyards where vegetation health was examined
Farmyard |
Legal Description |
Direction |
Distance (km) |
| Yard 1 | SE 9-6-29 |
E |
1.5 |
| Yard 2 | NE 4-6-29 |
SE |
2.1 |
| Yard 3 | SE 5-6-29 |
SSW |
2.2 |
| Control | NE 22-7-28 |
NE |
21.9 |
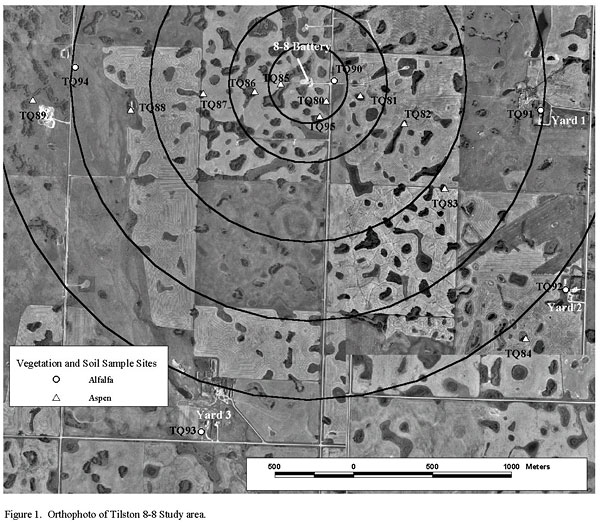
Figure 1. Orthophoto of Tilston 8-8 Study Area.-Click on image for a larger view
Trembling Aspen Monitoring
Ten sites were selected to collect leaves of trembling aspen trees to determine the concentration of sulphur in the foliage. Five sites were selected along each of two transects, one running southeast of the battery and one running west of the battery. The study design called for sites to be spaced along each transect at distances of 125m, 250m, 500m, 1km, and 2km from the battery. Although suitable natural vegetation was not available at the precise distances and directions identified in the study design, poplar bluffs that matched the distance and direction criteria as closely as possible were selected (Figure 1).
Three replicate samples of aspen leaves were obtained at each site by stripping leaves by hand from branches that could be reached from the ground. The samples were stored in paper bags and frozen within a few hours of sampling. Frozen samples were submitted to the Enviro-Test Laboratory for tissue analysis. Each sample was dried, ground and homogenized and subsampled for each analysis. Leaf samples were analyzed for total sulphur (S), iron (Fe), nitrogen (N), phosphorous (P), and potassium (K).
Alfalfa Monitoring
Four replicate samples of alfalfa were collected from fields and roadsides within 2.2 km of the 8-8 battery (August). The stems and leaves were dried, ground and analyzed for total S, Fe, P, K, and selenium (Se).
Soil Monitoring - Surface Organic Soils
Three replicate samples of the surface organic layer of soils were obtained from each of the five sites along the southeast and west transects. At each sample location, the vegetation was removed from an area approximately 15cm by 30cm. Using a plastic template as a guide, a sharp knife was used to cut out two 10cm by 10cm squares. A flat 10cm wide plastering trowel was used to help lift out each square of the organic layer. The depth of the organic layer (usually approximately 5 cm thick) was recorded to enable calculation of the total volume of the sample. Each replicate sample was comprised of two 10cm by 10cm squares of organic material.
Soil Monitoring - Mineral Soils
Fifteen-centimetre deep samples of the mineral soil were obtained with a 5cm diameter by 15cm long soil core sampler. Using its pile-driver handle, the sampling tube was driven into the ground in the area where the surface organic sample had been removed. Two 5cm by 15cm samples comprised each replicate sample and three replicate samples were collected at each site along each transect. The sampler was disassembled to remove each core sample, and soil adhering to the sampler was cleaned off prior to taking the next sample.
Soil Monitoring - Deeper Mineral Soils
Deeper soil samples (15 to 30 cm, 30 to 60 cm, 60 to 90 cm and 90 to 120 cm, provided rocks were not encountered) were collected from three locations to provide data on the baseline chemistry of the soil parent materials. A Dutch auger was used to collect the samples. After each bit full of soil was brought to the surface, the outer edges were pared off to remove any contamination that might have been picked up as it rubbed the wall of the hole while being removed. The remainder was then removed from the auger bit and placed in a sealed plastic bag.
Soil Handling and Analysis
The soil samples were frozen within a few hours. The frozen samples were submitted to Enviro-Test Laboratories for analyses including total S, and available sulphate (SO4), nitrate-nitrite (NO3-NO2), phosphate (PO4) and K.
Monitoring Schedule
Table 2. Sampling dates.
Date |
Vegetation Health |
Aspen Samples |
Alfalfa Samples |
Soil Samples |
|
Farmyards |
Aspen Bluffs |
||||
| May 31/99 | 3 |
3 |
3 |
||
| June 30/99 | 3 |
3 |
|||
| July 14/99 | 3 |
3 |
3 |
3 |
|
| Aug. 11/99 | 3 |
3 |
|||
| Aug. 25/99 | 3 |
3 |
3 |
3 |
|
| Sept. 1/99 | * |
* |
* |
* |
|
* Control farm NE of Sinclair NE22-7-28
Results and Discussions
Vegetation Condition Poplar bluffs within 200m of the battery in any direction:
Several aspen trees showed signs of insect damage, including rolled leaves and leaves that had been partially eaten.
Some aspen trees in the S and SW directions had interveinal chlorosis (yellow-green tissue between the veins of the leaves), a symptom that is sometimes indicative of chronic SO2 injury. However, the Crop Diagnostic Centre (MB Agriculture) determined this to be an iron deficiency symptom.
By June 30, a few aspen trees in each bluff (especially smaller trees along the edge) had developed brown areas along the leaf margins and between the veins. Although this resembled acute SO2 injury symptoms, the Crop Diagnostic Centre determined it to be a shoot blight fungal disease (Table 3). By August 11, leaves at the ends of affected branches had died and the stem had turned black, which is consistent with the development of the shoot blight disease.
The shoot blight fungal disease was also observed in the aspen bluff from the control farm (Table 4), indicating that the disease was not correlated in any way with the emissions of sulphur compounds.
No symptoms that resembled SO2 injury were observed on any plant species.
Monitoring sites
A few aspen trees at each location showed iron deficiency symptoms, and there was sporadic occurrence of the shoot blight disease at all sample locations. The occurrence of a similar level of shoot blight infection at the control farm confirmed that it was not related in any way to emissions in the study area.
- Alfalfa
No leaf damage from insects, disease or SO2 injury was observed on alfalfa in the study area or at the control farm. - Farmyards
Several species of trees, shrubs and flowers in the farmyards had injury symptoms or unhealthy appearance and were collected for further diagnosis. The Crop Diagnostic Centre determined the cause of the symptoms, and the results are presented in Tables 3 and 4. It is noteworthy that some of the same fungal infections were found in both the study area and the control farmyard, although there did seem to be a higher proportion of foliage affected in the study area. This was probably a result of natural variability in an abnormally wet year although the study was not able to rule out the remote chance that sulphur compounds in the air may have made the plants more susceptible to disease.
Table 3. Cause of leaf tissue damage within the study area as determined by the Crop Diagnostic Centre, Manitoba Agriculture.
Location / Date |
Plant |
Symptoms |
Disease Name / Type |
| Yard 3 99/06/15* |
Blue spruce | Brown needles & needle tips | Resembled SO2 injury but needle cast disease was confirmed in later samples |
| SE8-6-29 99/06/30 |
Aspen poplar | Chlorosis (yellowing) between veins | Iron deficiency |
| SE8-6-29 99/06/30 |
Aspen poplar | Brown lesions on the margins of leaves and between veins | Pollacia shoot blight / fungus |
| Yard 3 99/07/14 |
Blue spruce | Brown needle tips and brown needles on previous years growth | Winter injury Needle cast disease / fungus |
| Yard 3 99/07/14 |
Green ash | White flecks on leaves | Ash plant bugs / insects |
| Yard 3 99/07/14 |
Green ash | Leaf curling | Uncertain, possibly herbicide drift / herbicide such as 2-4D |
| Yard 3 99/07/14 |
Lilac | Brown lesions on the margins of the leaves | Leaf scorch / saline soils or stem injury from an unknown cause |
| Yard 3 99/07/14 |
Amur maple | Black spots on leaves | Tar spot / fungus |
| Yard 3 99/07/14 |
Manitoba maple | Leaves curled and light green colour | Herbicide drift / group 4 growth regulator herbicide, e.g. 2-4D |
| Yard 3 99/07/14 |
Apple | Chlorosis (yellowing) between veins | Iron deficiency |
| Yard 3 99/07/14 |
Apple | Brown spots or areas on the leaves | Frogeye leaf spot / fungus |
| Yard 3 99/07/14 |
Chokecherry | Spots on leaves and holes in the leaves | Shot hole / fungus |
| Yard 3 99/07/14 |
Petunia | Extremely chlorotic (yellow) | Nutrient deficiency |
| SW4-6-29 99/08/11 |
Aspen | Brown areas on the leaf margins and between the veins | Marssonina leaf spot / fungus Leaf rust / fungus |
| Yard 3 99/08/11 |
Blue spruce | Brown needle tips and brown needles on previous years growth | Rhizosphaera needle cast disease / fungus |
| Yard 3 99/08/11 |
Saskatoon | Chlorosis (yellow) between the veins & poor leaf colour | Iron deficiency + insect injury (aphids, leaf hoppers) |
| Yard 2 99/08/11 |
Caragana | Yellow leaves and some brown areas on the leaves | Septoria leaf spot / fungus |
| Yard 2 99/08/11 |
Lilac | Yellowing leaves and brown areas especially on the leaf margins | Nutritional deficiency with browning caused by dehydration of the stressed leaf tissues |
| Yard 2 99/08/11 |
Apple | Chlorosis and development of dry brown areas | Iron deficiency & stressed tissue is dehydrated |
| Yard 2 99/08/11 |
Ash | Chlorosis between veins | Iron deficiency |
| Yard 2 99/08/11 |
Raspberry | Yellowish leaves with some browning on the margins | Anthracnose / fungus |
| Yard 1 99/08/11 |
Elm | Yellowing areas on the leaves | Lace bugs which suck juices from the leaves |
| Yard 1 99/08/11 |
Cotoneaster | Shoot dieback with all leaves turning a reddish brown | Fire blight / bacterial disease |
| Yard 1 99/08/11 |
Cotoneaster | Brown spotted areas on the leaves | Larvae of the pear sawfly (pear slug) feeding damage |
| Yard 1 99/08/11 |
Chokecherry | Shot hole damage to leaves & some brown spots | Shothole (leaf spot) disease / fungus |
| Yard 1 99/08/11 |
Ash | Small white marks on the leaves & some areas brown | Insect feeding damage Anthracnose / fungus |
| Yard 1 99/08/11 |
Manitoba maple | Leaf curling on new growth, yellowing between the veins and occasional brown areas on the leaf margins | Stress symptoms, possibly caused by twig or branch canker diseases. |
| Yard 1 99/08/11 |
Saskatoon | Brown areas on the leaves | Entomosporium leaf spot / fungus |
*Collected by Glen Robertson, Environment Officer, Park-West Region
Table 4. Cause of leaf tissue damage at the control farm as determined by the Crop Diagnostic Centre, Manitoba Agriculture.
Location / Date |
Plant |
Symptoms |
Disease Name / Type |
| Control Yard 99/09/01 |
Lilac | White powdery material on the leaves | Powdery mildew / fungus |
| Control Yard 99/09/01 |
Chokecherry | Brown dry spots on leaves and some holes in leaves | Shot hole / fungus |
| Control Yard 99/09/01 |
Raspberry | Leaves drying and turning yellow and red | May be nutrient deficiency |
| Control Yard 99/09/01 |
Cotoneaster | Brown spotted areas on the leaves | This sample was lost in transit, but it resembled the sample from Yard 1. The diagnosis of the latter was feeding by pear sawfly larvae. |
| Control Yard 99/09/01 |
Manitoba maple | Misshapen leaves with light green colour | Leaf galls / Eriophyid mites Leaf spot disease (unidentified) / fungus |
| Control Yard 99/09/01 |
Apple | Brown areas along leaf margins Some areas on the leaves turning yellow or reddish brown |
Marginal leaf scorch / unknown Insect feeding damage Unidentified virus disease |
| NE22-7-28 99/09/01 |
Aspen | Brown necrotic areas on the leaves | Poplar rust |
| NE22-7-28 99/09/01 |
Aspen | Brown necrotic areas on the margins and between the veins of leaves | Marssonia leaf spot disease |
Chemical Analysis of Aspen
Samples of trembling aspen leaves were analyzed for total sulphur (S), total iron (Fe), available nitrogen (N), total phosphorous (P), and total potassium (K). The NPK analyses were done to provide backup data in case it appeared that nutrient deficiencies may have been a factor in vegetation health. The nutrient data are included in the tables but since there was no evidence of nutrient deficiencies, the nutrient data are not discussed in this report.
The total S in aspen leaves ranged from 1040 to 3530 m g/g (Appendix, Tables 5 and 6) which is within the normal range of 500 to 14,000 m g/g depending on the species (Malhotra and Hocking. 1976). Freedman and Hutchinson (1980) reported concentrations of S in aspen of 2700 m g/g at control sites in the Sudbury area compared to 4900 m g/g at sites close to the smelter. Data from the SE transect show a trend of decreasing S with distance from the 8-8 battery (Figure 2).
Figure 2. Mean concentration of total sulphur in leaves of trembling aspen along the SE transect from the 8-8 Battery.
The S in the aspen from the control site was slightly lower than at a few of the sites close to the battery. That suggests that there may have been some local effect from the S emissions, although it could also have been the result of variability in uptake of naturally occurring sulphur compounds. However, if the source of the S in the foliage had been the emissions from the 8-8 battery, the S content of the leaves from close-in sites should have increased markedly by August 25, 1999. Since that seasonal increase was not observed along the SE transect, sulphur compound emissions probably were not the cause of the slightly elevated S levels in the aspen leaves. At the site closest to the battery along the W transect, the S in the leaves did increase through the season (Figure 3). Based on these data, it appears that the average sulphur compound emissions may have had a very minor local effect on the S concentrations in aspen foliage but given the high variability in the data, the evidence is inconclusive. Sulphur is a necessary plant nutrient and the concentrations found in the aspen leaves of this study would not have a negative effect the growth and health of vegetation.
Chemical Analysis of Alfalfa
Samples of alfalfa were collected from four sites within 2.5 km of the 8-8 battery (Appendix Table 7). The concentrations of all chemical elements were highly variable. Unfortunately, no alfalfa samples could be found in close proximity to the 8-8 battery. The average total S in alfalfa collected from Yard 1 and Yard 2 was similar, but was lower in the samples collected near Yard 3. The alfalfa from the ditch 1.6 km west had the highest average S content. Since there is no other explanation for the differences, it appears that this can only be attributed to natural variability.
Chemical Analysis of Deeper Mineral Soils
Available SO4 was generally low, ranging from 24 to 48 m g/g in the 15 cm to 60 cm zone of the soil at all three sites (Appendix Table 10). It continued to be low in the 60 to 90 cm zones at two of the sites, 1 km W and 2 km SE of the battery. The third site, 125 m from the battery, was the exception with levels of SO4 increasing to 114 m g/g in the 60 to 90 cm zone and 132 m g/g in the 90 to 120 cm zone. It is unlikely that the SO4 in the deeper soils at the closest site was caused by the operation of the battery. If the elevated SO4 had originated from airborne deposition of sulphur compounds, the samples closer to the surface would also have been enriched. In any case, the concentration of SO4 in the deeper soils is lower than the amounts reported in by Eilers et al (1978) which indicates that there has been no abnormal elevation of SO4 in the soils of the study area.
The total S in the soil was highest at the surface and decreased with depth at all three sites. At first, one might wonder whether this was the result of the deposition of sulphur compounds at the surface. However, for this to be the case total S in the organic and near surface mineral layers close to the battery would have been elevated and that was not observed. Rather, the S appears to be from the decaying plant material at the soil surface which was to be expected given that S in aspen leaves was often in the 1000 to 3000 m g/g range.
Figure 5. Mean concentration of available sulphate in surface organic and the mineral soil directly beneath it along the W transect.
Figure 6. Mean concentration of total sulphur in surface organic and the mineral soil directly beneath it along the SE transect.
Figure 7. Mean concentration of total sulphur in surface organic and the mineral soil directly beneath it along the W transect.
Conclusions
- Although several plants in the study area and control farm had leaf injury, disease (mostly fungus) or insects caused all the symptoms. There were no visible symptoms of SO2 injury on plants in this study area and there were no plant injuries that might have been caused by other pollutants.
- Although many of the same fungal diseases found in trees and shrubs of farmyards in the study area were also found in the control yard, there appeared to be more infected leaf tissue in the study area. This was probably a result of natural variability in such an abnormally wet year but the study was not able to rule out the remote chance that sulphur compounds in the air may have made the plants more susceptible to disease.
- The sulphur content of aspen leaves suggested that there may have been some elevation caused by the battery emissions at one close-in site, but the data were too variable to reach a definitive conclusion. S in aspen leaves was in the normal range and would not be detrimental to plant health.
- Available sulphate in the surface soil was slightly elevated at locations within 500m of the 8-8 battery. Considering the small data set and the variability in the data, there is no conclusive evidence that emissions of sulphur compounds were the cause. Sulphate content of soils was in the low part of the range or less than that reported for the same soil type at another location in the southwest corner of Manitoba.
- Total sulphur in the soil was variable and the concentrations did not decrease with distance from the 8-8 battery, indicating that sulphur compounds emitted from the battery did not affect this parameter.
References
Dreisinger, Bruce R. and Peter C. McGovern. 1970. Monitoring Atmospheric Sulphur Dioxide and Correlating its Effects on Crops and Forests in the Study Area. Proceedings of the Impact of Air Pollution on Vegetation Conference Toronto, Ontario, April 7-9, 1970. p.11-28.
Eilers, R. G., L. A. Hopkins, and R. E. Smith. 1978. Soils of the Boissevain-Melita Area. Manitoba Soil Survey Report No. 20. Canada-Manitoba Soil Survey 204 pp.
Green, Don. Forage Specialist, Manitoba Agriculture, Carman, Manitoba. Personal Communication.
Malhotra, S. S. and D. Hocking. 1976. Biochemical and Cytological Effects of Sulphur Dioxide on Plant Metabolism. New Phytol. 76: 227-237.
Freedman, B. and T. C. Hutchinson. 1980. Pollutant Inputs from the Atmosphere and Accumulations in Soils and Vegetation near a Nickel-Copper Smelter at Sudbury, Ontario, Canada. Can. J. Botany 58: 108-132.
Shipley, B. L. 1975. Short and Long Term Effects of Sulphur Gas Emissions on the Gray Wooded and Dark Gray Wooded Soils as Evidenced by Studies in the Whitecourt and Edson Forest Regions of Alberta. Proceedings of Alberta Sulphur Gas Research Workshop II. p.84-93.
Appendix: Data Tables
Table 5. Aspen tissue analysis data (m g/g except for N%) for sites SE of the 8-8 battery
Distance |
Control |
|||||||
Analyte |
Date |
Rep |
125 m SE |
250 m SE |
500 m SE |
1000m SE |
2000m SE |
21 km NE |
| Total S | May 31/99 | 1 |
2090 |
1740 |
2120 |
1570 |
1540 |
|
2 |
1870 |
1780 |
1770 |
1610 |
1170 |
|||
3 |
1920 |
1510 |
1970 |
1530 |
1370 |
|||
| July 14/99 | 1 |
2520 |
2850 |
2020 |
1260 |
1360 |
||
2 |
1900 |
2890 |
1630 |
1530 |
1040 |
|||
3 |
2230 |
1730 |
1810 |
1170 |
1220 |
|||
| Aug 25/99 | 1 |
1780 |
2250 |
1470 |
1450 |
1720 |
1710 |
|
2 |
1580 |
1900 |
2080 |
1320 |
1480 |
1330 |
||
3 |
3530 |
1940 |
1690 |
1300 |
1180 |
1510 |
||
| Total Fe | May 31/99 | 1 |
69 |
49 |
54 |
56 |
72 |
|
2 |
62 |
44 |
138 |
60 |
62 |
|||
3 |
56 |
46 |
56 |
69 |
78 |
|||
| July 14/99 | 1 |
122 |
68 |
90 |
78 |
130 |
||
2 |
86 |
44 |
93 |
83 |
100 |
|||
3 |
106 |
89 |
93 |
68 |
113 |
|||
| Aug 25/99 | 1 |
149 |
122 |
114 |
95 |
223 |
122 |
|
2 |
123 |
123 |
137 |
87 |
179 |
151 |
||
3 |
244 |
113 |
120 |
131 |
127 |
162 |
||
| Avail. N % | May 31/99 | 1 |
3.74 |
3.13 |
4.31 |
3.44 |
2.54 |
|
2 |
3.3 |
2.63 |
4.2 |
3.34 |
2.94 |
|||
3 |
3 |
2.49 |
4.13 |
3.22 |
2.67 |
|||
| July 14/99 | 1 |
2.24 |
2.4 |
2.88 |
2.33 |
2.4 |
||
2 |
1.89 |
1.82 |
3.11 |
2.7 |
2.15 |
|||
3 |
2.78 |
2.34 |
2.8 |
2.22 |
2.36 |
|||
| Aug 25/99 | 1 |
1.75 |
1.75 |
1.65 |
1.94 |
1.61 |
2.8 |
|
2 |
1.75 |
2.06 |
1.99 |
1.92 |
1.95 |
2.8 |
||
3 |
1.77 |
1.69 |
1.88 |
2.05 |
1.82 |
2.0 |
||
| Total P | May 31/99 | 1 |
3160 |
2690 |
5630 |
3630 |
2620 |
|
2 |
3540 |
3080 |
5250 |
3670 |
2740 |
|||
3 |
3060 |
2600 |
4980 |
3530 |
2300 |
|||
| July 14/99 | 1 |
1800 |
1500 |
2290 |
2020 |
1590 |
||
2 |
1460 |
1560 |
2220 |
2180 |
1610 |
|||
3 |
1790 |
1610 |
1920 |
1810 |
1800 |
|||
| Aug 25/99 | 1 |
1600 |
1390 |
1580 |
1850 |
1540 |
2110 |
|
2 |
1600 |
1710 |
1810 |
1820 |
1410 |
1960 |
||
3 |
1600 |
1610 |
1850 |
1970 |
1630 |
1900 |
||
| Total K | May 31/99 | 1 |
13500 |
10600 |
19300 |
14800 |
10400 |
|
2 |
12300 |
9910 |
16500 |
15000 |
10700 |
|||
3 |
11300 |
9690 |
16200 |
13900 |
9730 |
|||
| July 14/99 | 1 |
5670 |
7160 |
8470 |
7750 |
9750 |
||
2 |
5240 |
7380 |
10200 |
8130 |
5350 |
|||
3 |
5450 |
8340 |
7500 |
7180 |
7760 |
|||
| Aug 25/99 | 1 |
5110 |
4590 |
3300 |
6450 |
7030 |
6880 |
|
2 |
5610 |
5830 |
4590 |
5610 |
6710 |
7490 |
||
3 |
8790 |
5790 |
7110 |
6640 |
5170 |
8740 |
||
Table 6. Aspen tissue analysis data (m g/g except for N%) for sites W of the 8-8 battery.
Distance |
|||||||
Analyte |
Date |
Rep |
125 m W |
250 m W |
500 m W |
1000m W |
2000m W |
| Total S | May 31/99 | 1 |
1700 |
1410 |
1330 |
1290 |
2570 |
2 |
2200 |
1230 |
1670 |
1210 |
2170 |
||
3 |
2020 |
1350 |
1620 |
1420 |
2380 |
||
| July 14/99 | 1 |
3050 |
2110 |
1590 |
846 |
1930 |
|
2 |
2530 |
1820 |
1340 |
837 |
4510 |
||
3 |
2880 |
1350 |
2060 |
881 |
820 |
||
| Aug 25/99 | 1 |
4390 |
1640 |
1660 |
1400 |
2600 |
|
2 |
3980 |
1750 |
1450 |
2510 |
4500 |
||
3 |
5530 |
1850 |
1590 |
1220 |
6750 |
||
| Total Fe | May 31/99 | 1 |
43 |
56 |
63 |
99 |
84 |
2 |
50 |
50 |
70 |
70 |
53 |
||
3 |
57 |
49 |
64 |
76 |
79 |
||
| July 14/99 | 1 |
115 |
83 |
79 |
113 |
77 |
|
2 |
72 |
83 |
66 |
105 |
69 |
||
3 |
77 |
78 |
94 |
93 |
78 |
||
| Aug 25/99 | 1 |
167 |
131 |
130 |
145 |
176 |
|
2 |
173 |
94 |
127 |
174 |
112 |
||
3 |
174 |
120 |
112 |
117 |
110 |
||
| Avail. N % | May 31/99 | 1 |
2.09 |
2.86 |
3.71 |
3.66 |
5.22 |
2 |
2.19 |
2.92 |
3.65 |
3 |
3.59 |
||
3 |
2.79 |
3.06 |
3.33 |
2.83 |
5.06 |
||
| July 14/99 | 1 |
2.46 |
2.98 |
2.2 |
3.27 |
3.17 |
|
2 |
2.29 |
2.71 |
2.39 |
2.3 |
2.1 |
||
3 |
2.4 |
2.6 |
3.51 |
1.87 |
2.22 |
||
| Aug 25/99 | 1 |
1.85 |
1.54 |
1.71 |
1.61 |
1.57 |
|
2 |
1.86 |
1.67 |
1.78 |
1.63 |
2.04 |
||
3 |
1.61 |
1.75 |
1.85 |
1.26 |
2.05 |
||
| Total P | May 31/99 | 1 |
2280 |
2790 |
3570 |
4070 |
6340 |
2 |
2220 |
2890 |
4770 |
3220 |
3170 |
||
3 |
3020 |
3010 |
3720 |
3210 |
6080 |
||
| July 14/99 | 1 |
1650 |
1980 |
2170 |
2460 |
1880 |
|
2 |
1650 |
1740 |
1820 |
1910 |
1570 |
||
3 |
1880 |
2110 |
2420 |
1820 |
1740 |
||
| Aug 25/99 | 1 |
1500 |
1710 |
1680 |
1560 |
1510 |
|
2 |
1700 |
1840 |
2000 |
1380 |
1580 |
||
3 |
1650 |
1660 |
1770 |
1280 |
1640 |
||
| Total K | May 31/99 | 1 |
10300 |
9940 |
14600 |
11400 |
21900 |
2 |
10300 |
10100 |
17400 |
11100 |
13500 |
||
3 |
12000 |
9500 |
13300 |
11400 |
20700 |
||
| July 14/99 | 1 |
12600 |
8670 |
10100 |
5540 |
11800 |
|
2 |
9170 |
7700 |
9910 |
9390 |
10000 |
||
3 |
8450 |
10200 |
10600 |
7590 |
11300 |
||
| Aug 25/99 | 1 |
7450 |
8080 |
8110 |
5520 |
4540 |
|
2 |
8150 |
8230 |
12300 |
5820 |
6850 |
||
3 |
7060 |
7400 |
7730 |
6570 |
7030 |
||
Table 7. Alfalfa tissue analysis data (m g/g) for sites in the vicinity of the 8-8 battery.
Analyte |
Rep |
Site, Distance and Direction |
|||
Yard 1 1.7 km E |
Yard 2 2 km SE |
Yard 3 2.4 km SSW |
Ditch 1.6 km W |
||
| Total S | 1 |
1730 |
3020 |
1200 |
3420 |
2 |
2860 |
2190 |
1350 |
4050 |
|
3 |
1600 |
2220 |
1510 |
2800 |
|
| Total Fe | 1 |
73 |
75 |
107 |
239 |
2 |
96 |
84 |
140 |
231 |
|
3 |
53 |
105 |
222 |
136 |
|
| Total P | 1 |
3340 |
2640 |
2520 |
1980 |
2 |
4300 |
2710 |
2860 |
1990 |
|
3 |
2910 |
2770 |
2930 |
1880 |
|
| Total K | 1 |
27200 |
31000 |
27600 |
14900 |
2 |
47700 |
21500 |
28600 |
23100 |
|
3 |
30000 |
24500 |
25100 |
14600 |
|
| Total Se | 1 |
0.57 |
0.43 |
0.46 |
0.25 |
2 |
0.82 |
0.37 |
0.64 |
0.13 |
|
3 |
0.6 |
0.35 |
0.82 |
0.08 |
|
Appendix: Data Tables
Table 8. Soil analysis data (m g/g) for soil samples collected at sites SE of the 8-8 battery.
Analyte |
Soil Type |
Replicate # |
Distance from the 8-8 Battery |
Control |
||||
125m SE |
250m SE |
500m SE |
1000m SE |
2000m SE |
21 km NE |
|||
| Avail. SO4 | Organic | 1 |
171 |
258 |
66 |
33 |
33 |
168 |
| c | * | 2 |
93 |
1420 |
180 |
54 |
21 |
138 |
| *v | * | 3 |
159 |
240 |
252 |
2100 |
231 |
240 |
| * | Mineral | 1 |
18 |
195 |
51 |
24 |
18 |
96 |
| * | * | 2 |
75 |
720 |
60 |
15 |
18 |
47 |
| * | * | 3 |
120 |
252 |
150 |
72 |
24 |
105 |
| Total S | Organic | 1 |
857 |
925 |
893 |
517 |
818 |
1550 |
| * | * | 2 |
673 |
1060 |
1240 |
844 |
687 |
1330 |
| * | * | 3 |
851 |
796 |
1110 |
910 |
1000 |
1230 |
| * | Mineral | 1 |
632 |
878 |
1080 |
496 |
1060 |
705 |
| * | * | 2 |
628 |
990 |
892 |
467 |
797 |
591 |
| * | * | 3 |
602 |
792 |
851 |
619 |
1040 |
796 |
| NO3-NO2 | Organic | 1 |
27.9 |
41.9 |
16.6 |
28.4 |
18.9 |
10.4 |
| * | * | 2 |
27.7 |
18.9 |
151 |
34.5 |
28.4 |
8.4 |
| * | * | 3 |
33.4 |
40.2 |
42.6 |
53.2 |
48.5 |
10.4 |
| * | Mineral | 1 |
14.8 |
16.1 |
21.6 |
10.8 |
24.5 |
6.4 |
| * | * | 2 |
13.3 |
11.8 |
24.5 |
9.7 |
23.7 |
7.2 |
| * | * | 3 |
9.5 |
14.2 |
22.4 |
10.8 |
19.9 |
7.6 |
| Avail. PO4 | Organic | 1 |
10.8 |
23.3 |
27.4 |
25.3 |
30 |
10.0 |
2 |
12.2 |
16 |
63.6 |
25.8 |
20.6 |
19.0 |
||
3 |
22 |
33.3 |
78.3 |
29.4 |
27.9 |
39.0 |
||
| Mineral | 1 |
6.4 |
9.1 |
18.2 |
12.8 |
11.3 |
2.6 |
|
2 |
7.4 |
10.8 |
16.9 |
4.4 |
25 |
13.0 |
||
3 |
8.1 |
10.8 |
27.4 |
7.4 |
9.3 |
584 |
||
| Avail. K | Organic | 1 |
696 |
810 |
492 |
910 |
600 |
858 |
2 |
668 |
468 |
548 |
755 |
725 |
1370 |
||
3 |
912 |
975 |
660 |
750 |
615 |
1590 |
||
| Mineral | 1 |
472 |
516 |
476 |
672 |
740 |
613 |
|
2 |
488 |
392 |
548 |
512 |
1030 |
578 |
||
3 |
504 |
448 |
572 |
584 |
592 |
584 |
||
Table 9. Soil analysis data (m g/g) for soil samples collected at sites W of the 8-8 battery.
Analyte |
Soil Type |
Replicate # |
Distance from the 8-8 battery |
||||
125m W |
250m W |
500m W |
1000 m W |
2000 m W |
|||
| Avail. SO4 | Organic | 1 |
294 |
504 |
126 |
90 |
117 |
2 |
306 |
126 |
108 |
57 |
51 |
||
3 |
174 |
150 |
174 |
36 |
114 |
||
| Mineral | 1 |
150 |
336 |
18 |
27 |
45 |
|
2 |
318 |
153 |
21 |
69 |
180 |
||
3 |
30 |
126 |
24 |
42 |
159 |
||
| Total S | Organic | 1 |
711 |
846 |
691 |
1300 |
1110 |
2 |
697 |
752 |
790 |
883 |
1090 |
||
3 |
627 |
692 |
844 |
774 |
1390 |
||
| Mineral | 1 |
530 |
900 |
624 |
763 |
927 |
|
2 |
798 |
785 |
599 |
766 |
1030 |
||
3 |
558 |
759 |
582 |
664 |
1140 |
||
| N03-NO2 | Organic | 1 |
26 |
49.6 |
20.1 |
70.9 |
42.6 |
2 |
28.4 |
96.9 |
70.9 |
6.9 |
42.3 |
||
3 |
18.9 |
16.6 |
33.1 |
31.7 |
40.7 |
||
| Mineral | 1 |
5.5 |
27.3 |
11.6 |
19.7 |
23.3 |
|
2 |
8.5 |
28.8 |
12.3 |
17.8 |
25.4 |
||
3 |
4.6 |
27.5 |
7.8 |
18 |
19.9 |
||
| Avail. PO4 | Organic | 1 |
33.3 |
36.2 |
44 |
73.4 |
28.4 |
2 |
27.9 |
34.2 |
39.1 |
44 |
15.5 |
||
3 |
58.7 |
31.3 |
53.8 |
34.2 |
33.3 |
||
| Mineral | 1 |
18.2 |
13.2 |
8.8 |
33.3 |
5.9 |
|
2 |
17.2 |
9.8 |
15.2 |
12.8 |
3.7 |
||
3 |
23.8 |
8.3 |
15.7 |
19.1 |
5.9 |
||
| Avail. K | Organic | 1 |
710 |
600 |
720 |
1080 |
584 |
2 |
504 |
530 |
720 |
1170 |
580 |
||
3 |
1060 |
665 |
630 |
850 |
855 |
||
| Mineral | 1 |
412 |
480 |
468 |
940 |
524 |
|
2 |
540 |
500 |
508 |
1080 |
476 |
||
3 |
720 |
576 |
508 |
552 |
508 |
||
Table 10. Soil analysis data (m g/g) for deeper mineral soils collected at selected sites in the vicinity of the 8-8 battery.
Analyte |
Depth |
Distance and Direction |
Control |
||
125m SE |
2000m SE |
1000m W |
21 km NE |
||
| Avail. SO4 | 15-30 cm | 24 |
48 |
30 |
62 |
| 30-60 cm | 45 |
24 |
24 |
37 |
|
| 60-90 cm | 114 |
33 |
21 |
30 |
|
| 90-120 cm | 132 |
* |
* |
37 |
|
| Total S | 15-30 cm | 615 |
824 |
525 |
700 |
| 30-60 cm | 427 |
277 |
219 |
169 |
|
| 60-90 cm | 532 |
210 |
184 |
254 |
|
| 90-120 cm | 331 |
* |
* |
621 |
|
| NO3-NO2 | 15-30 cm | 11.4 |
12.3 |
14.2 |
9.4 |
| 30-60 cm | 4.6 |
2.1 |
4.9 |
3.0 |
|
| 60-90 cm | 3 |
2.3 |
4.2 |
2.2 |
|
| 90-120 cm | 1.7 |
* |
* |
1.8 |
|
| Avail. PO4 | 15-30 cm | 3.4 |
2.4 |
23.6 |
2.0 |
| 30-60 cm | 0.5 |
0.5 |
4.4 |
0.5 |
|
| 60-90 cm | 0.5 |
0.5 |
2 |
0.5 |
|
| 90-120 cm | 0.5 |
* |
* |
0.5 |
|
| Avail. K | 15-30 cm | 289 |
528 |
852 |
540 |
| 30-60 cm | 113 |
126 |
524 |
302 |
|
| 60-90 cm | 75 |
126 |
254 |
302 |
|
| 90-120 cm | 51 |
* |
* |
149 |
|
* stones encountered, no sample collected