
Fiscally
Responsible
Outcomes and Economic
Growth
Strategy
Fiscal Strategy
The Fiscal Responsibility and Taxpayer Protection Act requires the minister of finance to present to the house on budget day a report on the government’s fiscal responsibility strategy.Manitoba’s fiscal strategy considers the province’s financial health in the context of the overall socio-economic environment and financial conditions. It guides managing revenues, expenditures and capital infrastructure investments in a way that is consistent with short-term intentions and long-term objectives of building fiscal resilience while meeting the needs of Manitobans today and into the future.
The fiscal strategy includes the following key objectives:
- consider the needs and well-being of present and future generations and the environment
- ensure that all of summary government resources are managed effectively and efficiently
- maintain an efficient, fair and stable revenue strategy
- take prudent and responsible steps to return to budgetary balance
- once fiscal balance has been achieved, make best efforts to gradually reduce the provincial debt
As outlined under the fiscal indicators section below, Budget 2022 includes several indicators to help guide and evaluate progress on the fiscal strategy. The indicators also tie the plans in the budget to the reporting on the government’s fiscal health in the annual Public Accounts.
Where does my money go?
Revenues and expenditures at a glance
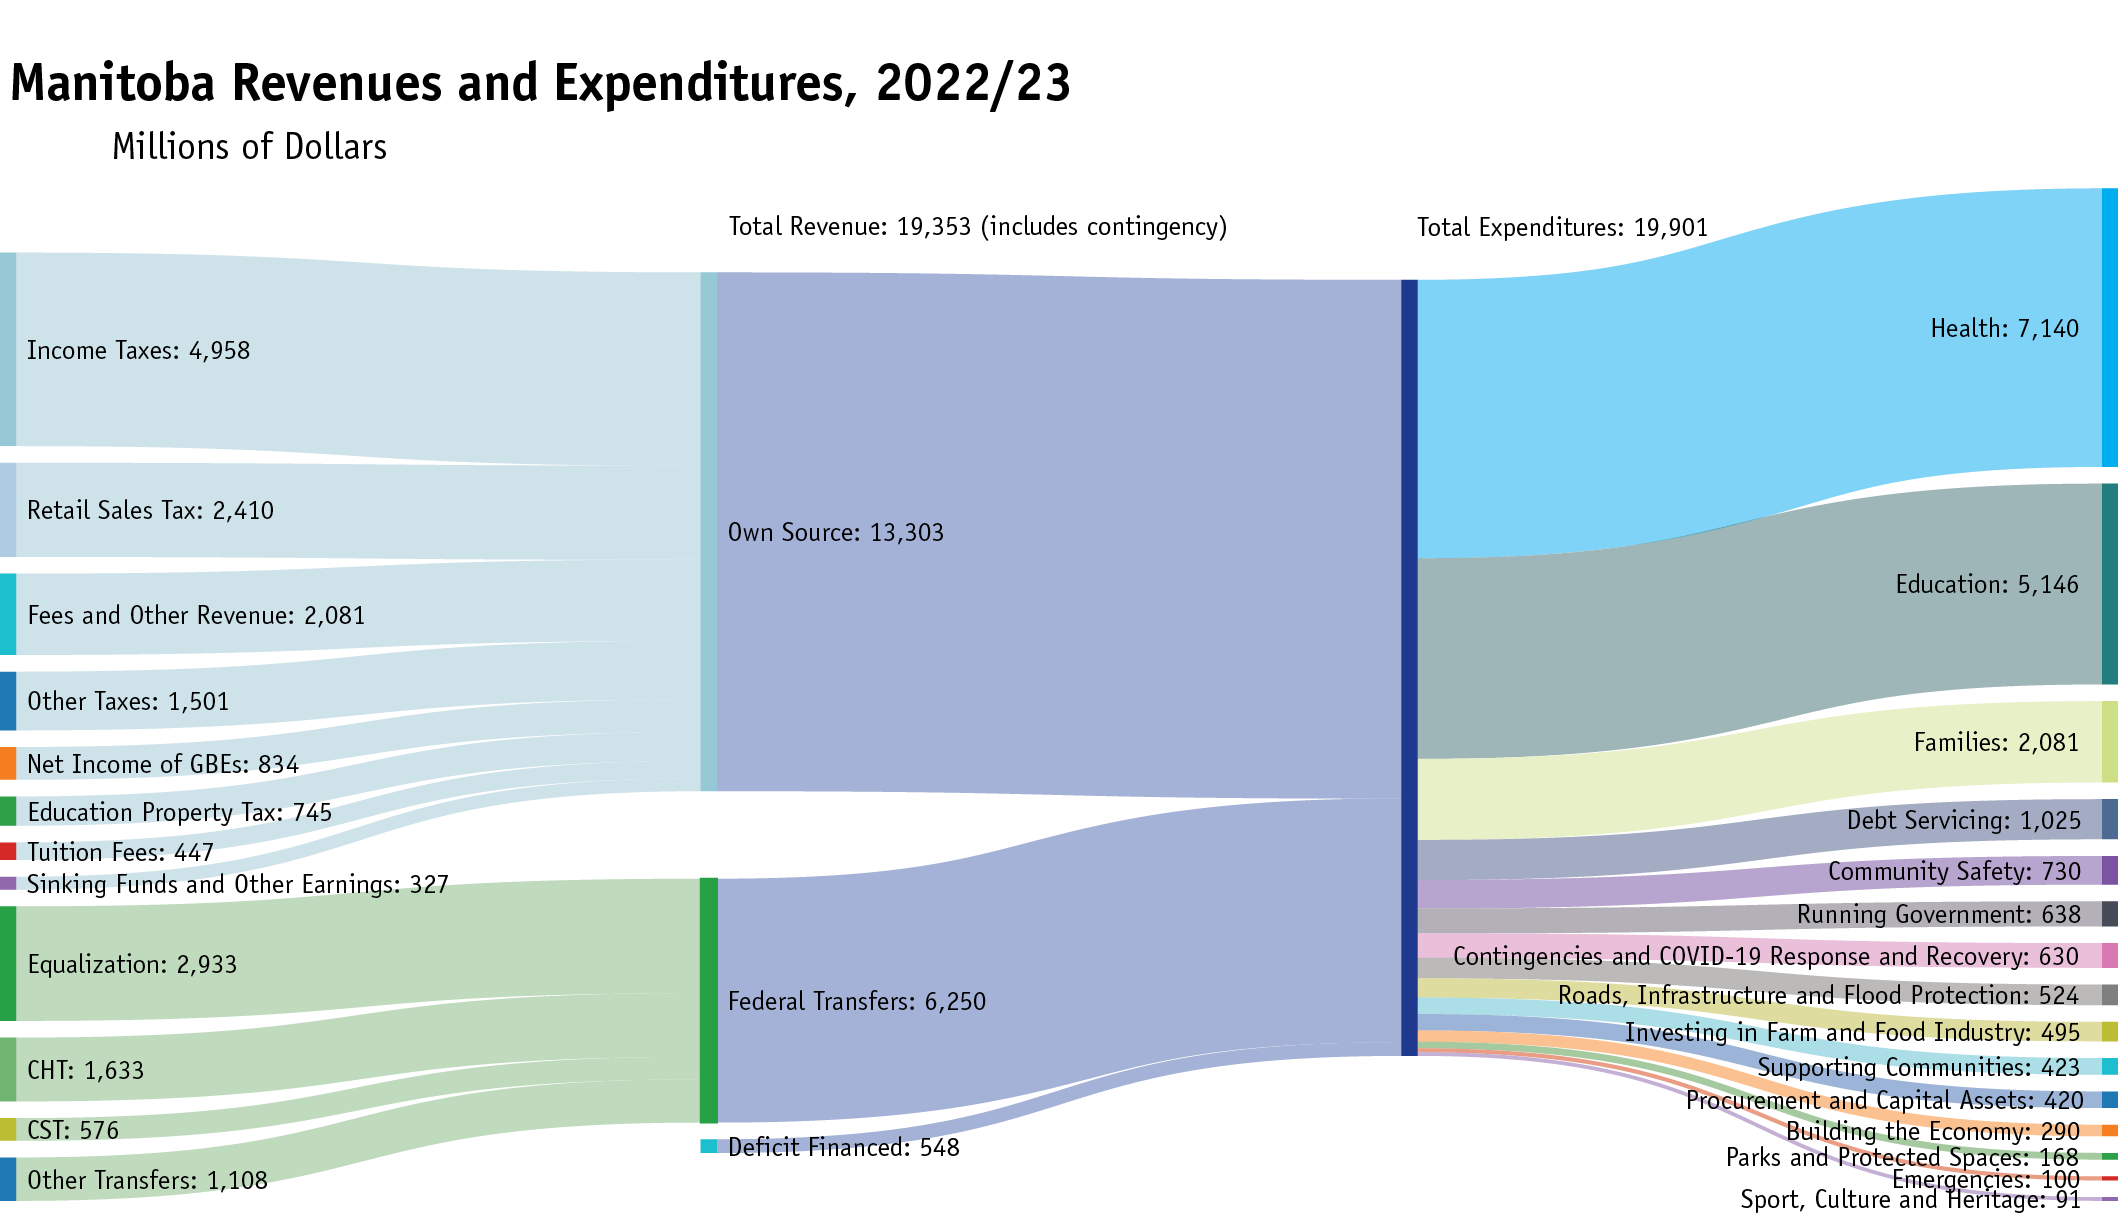
Budgeting requires a careful management of over $19 billion of own-source revenues and federal transfers with expenditures that flow to departments and other reporting entities that comprise the summary government.As illustrated, health care accounts for approximately 36 per cent of the total budget and, including education and supports for social services and families, this is 72 per cent of the budget. An ongoing challenge in managing expenditures is the provincial net debt, which is projected at over $30 billion in 2022/23, requiring annual servicing costs of over $1 billion. With interest rates expected to increase, costs to service the debt will correspondingly rise.
Fiscal Outlook
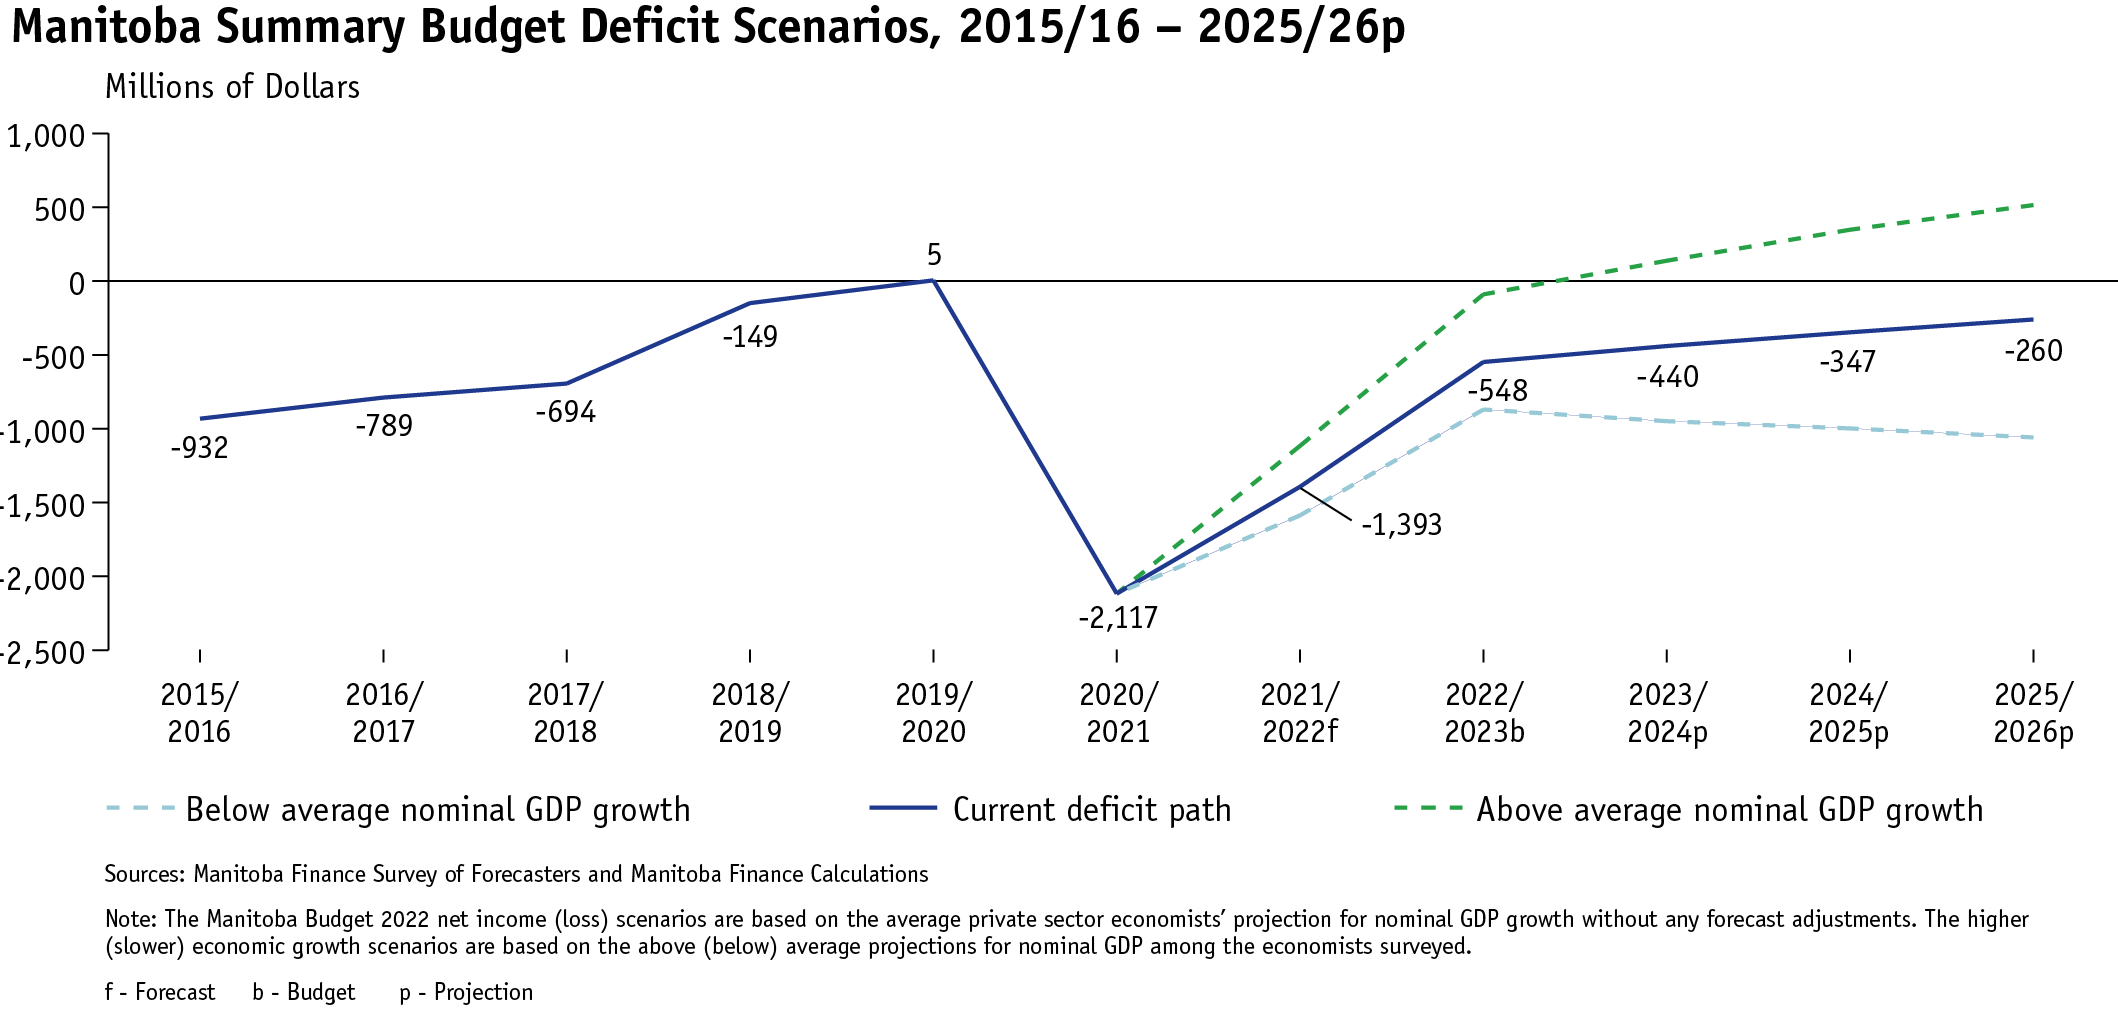
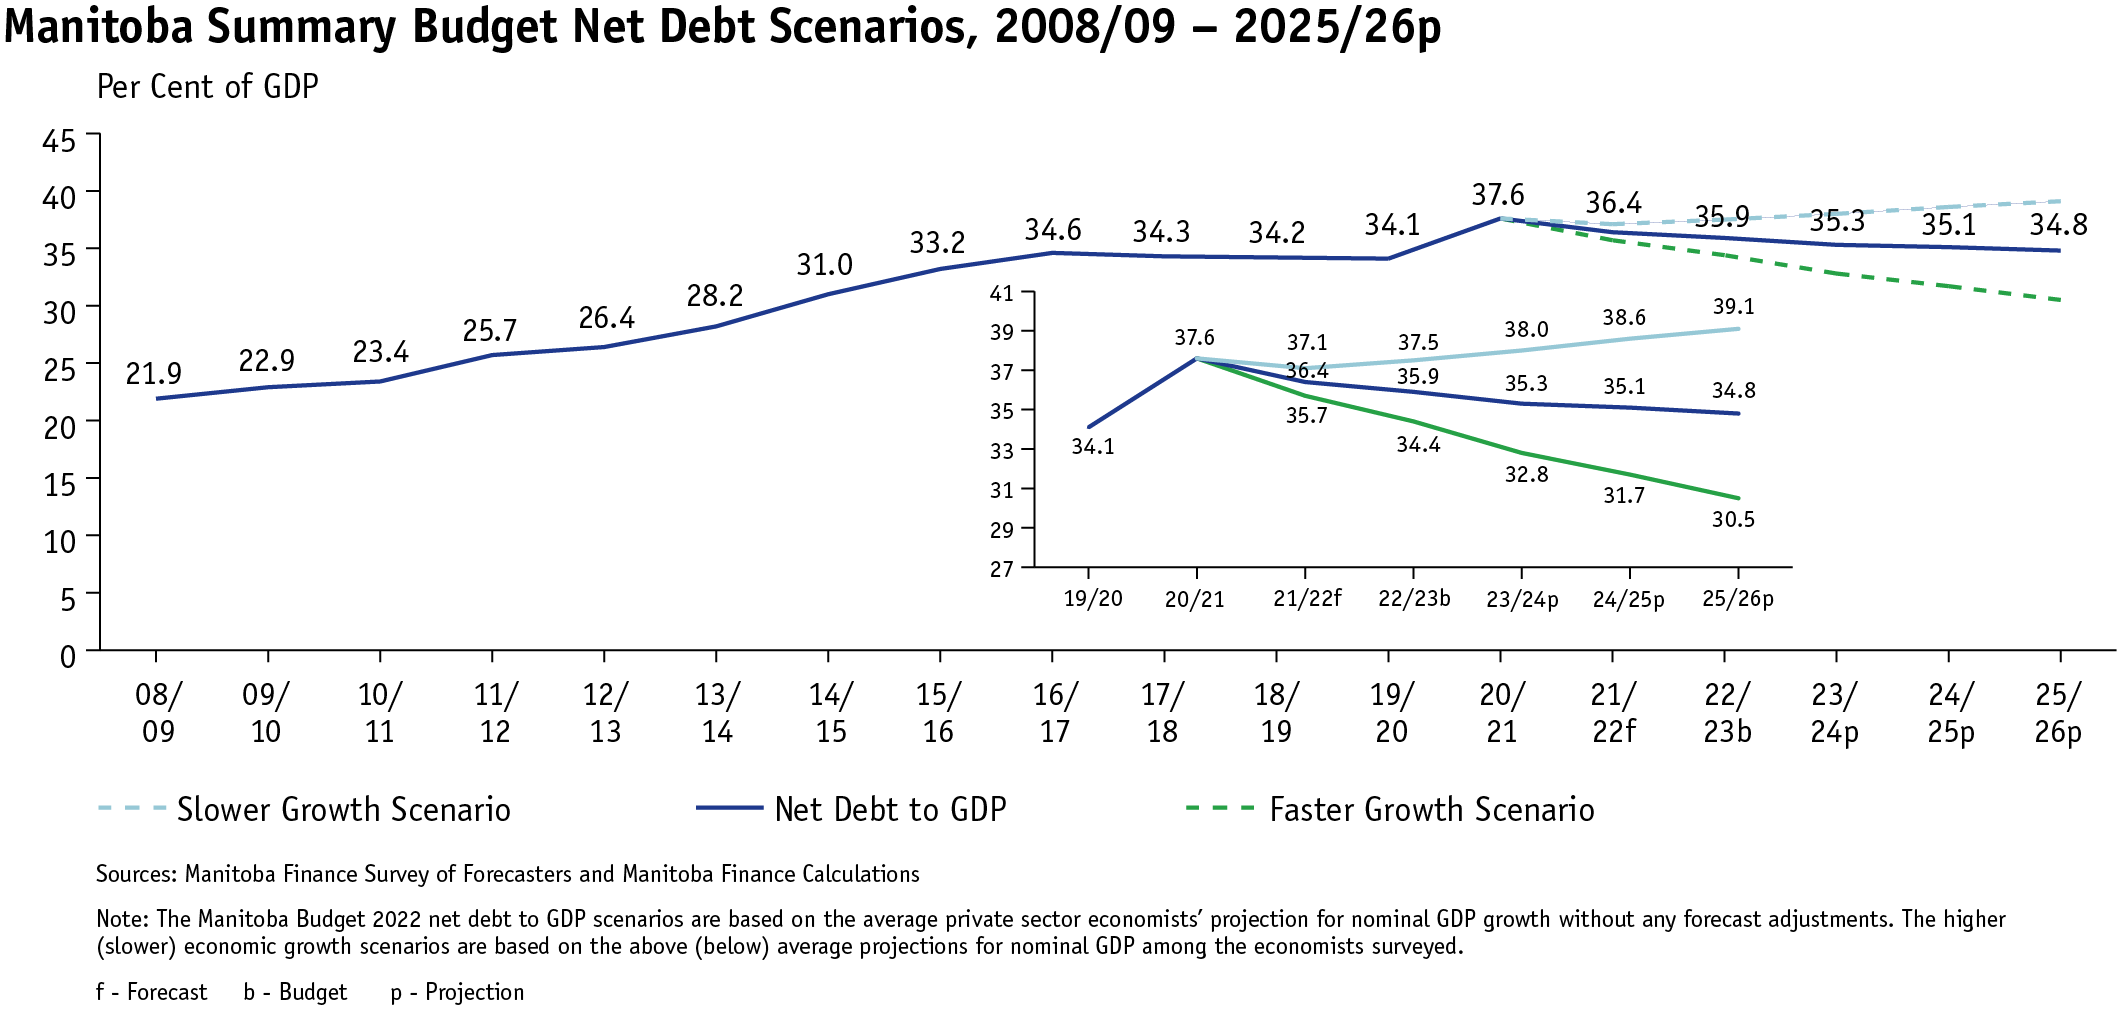
Manitoba’s fiscal outlook is informed by the economic outlook and review. The interim forecast for the 2021/22 fiscal year, which will be finalized in the Public Accounts for the fiscal year, is a deficit of $1,393 million. The Budget 2022 plan for 2022/23 is a deficit of $548 million.The medium-term plan shows declining deficits over the fiscal outlook from $440 million in 2023/24 to $260 million in 2025/26. The outlook also shows Manitoba’s net-debt to GDP ratio below 35 per cent in the last year of the fiscal plan, returning to pre-COVID-19 levels.
|
Fiscal Summary and Outlook |
||||||
|
Actual |
Forecast |
Budget |
Medium Term |
|||
|
2020–21 |
2021–22f |
2022–23b |
2023–24p |
2024–25p |
2025–26p |
|
|
Millions of Dollars |
||||||
|
Revenue |
17,819 |
18,692 |
19,553 |
20,007 |
20,610 |
21,265 |
|
Expenditures |
||||||
|
Programs |
18,967 |
19,120 |
18,876 |
19,358 |
19,741 |
20,111 |
|
Interest on Debt |
969 |
965 |
1,025 |
1,088 |
1,216 |
1,414 |
|
Total Expenditures |
19,936 |
20,085 |
19,901 |
20,447 |
20,957 |
21,525 |
|
Surplus/(Deficit) Before Reserve |
(2,117) |
(1,393) |
(348) |
(440) |
(347) |
(260) |
|
Planning Contingencies |
(200) |
|||||
|
Surplus/(Deficit) |
(2,117) |
(1,393) |
(548) |
(440) |
(347) |
(260) |
|
Net Debt as a Per Cent of GDP |
37.6% |
36.4% |
35.9% |
35.3% |
35.1% |
34.8% |
f- Forecast b - Budget p - Projection
Sources: Manitoba Finance
Note: Numbers may not add due to rounding.
Challenging environment for forecasting
Manitoba finance surveys nine private-sector economic forecasters on its economic outlook. The average of the forecasts is used for fiscal planning purposes. Changes in the economic forecast impacts the estimates for provincial revenues and expenses. The graph illustrates the uncertainty inherent in the forecast over the coming years.
Fiscal Indicators
Budget 2022 highlights several fiscal indicators to guide the fiscal strategy. These indicators assist in the assessment of a government’s financial condition and also align with those in the annual provincial Public Accounts, as recommended by the Public Sector Accounting Board. The indicators also compare budgetary expenditures with the growth in Manitoba’s economy and with other provinces.The indicators, expressed as ratios or trends, provide a fiscal target that may be used in the assessment of the government’s financial health in the context of the current socio-economic and financial environments. Similar metrics are used as key indicators by credit rating agencies to assess a province’s credit strengths and challenges.
The government’s progress on the fiscal strategy’s objectives are informed by these indicators, which serve as anchors to measure the extent to which budget plans are being accomplished. These metrics help guide the work to address the deficit and the debt, improve the efficiency of government and build the path to progressing towards balanced outcomes together.
The indicators are grouped into the following categories:
Sustainability Indicators
Measures a government’s ability to maintain its delivery of programs and services.
Indicators:
- expenditure as a share of provincial GDP
- annual net income or loss
- net debt as a share of provincial GDP
Flexibility Indicator
Measures how well a government can respond to rising financial commitments by either expanding its revenue or increasing its borrowings.
Indicator:
- public debt charges to total revenue
Vulnerability Indicator
Measures how much a government relies on revenue sources beyond its direct control or influence, both domestically and internationally.
Indicator:
- federal transfers to total revenue
Sustainability Indicators:
Expenditure as a share of provincial GDP
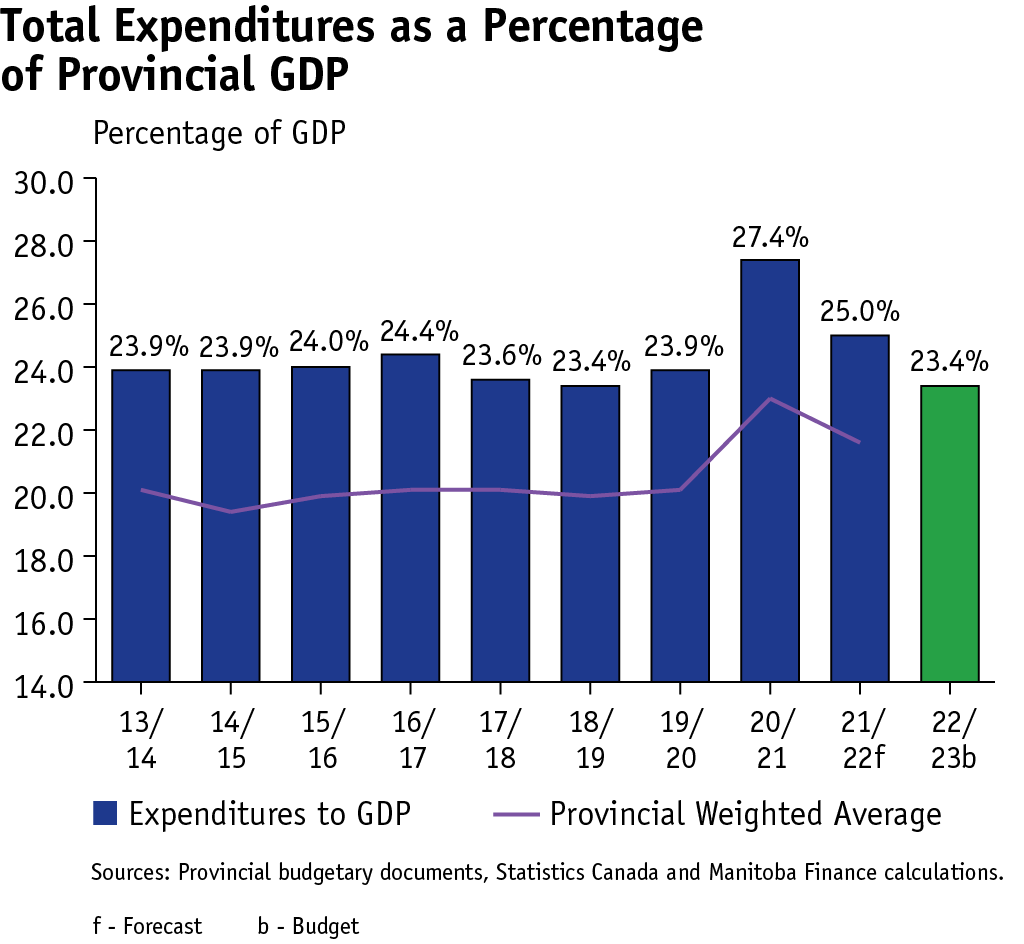
Expenditures as a percentage of the provincial economy, measured by Gross Domestic Product (GDP), indicates the amount of annual government spending on programs and other costs as a share of the total GDP. This ratio provides a way to assess a government’s financial management strengths.
Spending, particularly discretionary expenditures, is one aspect of public finance that governments control the most. Spending as a share of GDP puts the provincial expenditure budget into context within Manitoba’s economic circumstances.
As shown in the graph, before the COVID-19 impact, Manitoba’s total expenditures, as a share of the economy was moving towards the provincial weighted average. Budget 2022 proposes to spend almost $20 billion compared to a GDP of $85 billion or 23 per cent. The fiscal anchor is to keep the total expenditure as a share of provincial GDP below 25 per cent.
Annual net income or loss
This indicator represents the government’s summary bottom line, and re-establishes a responsible approach to balance Manitoba’s budget over a number of years. The ratio of net income (loss)-to-provincial GDP measures the difference between revenues and expenses expressed as a percentage of GDP. It is a measure of a government’s ability to meet its financing needs and to ensure proper management of public finances.
Given the ongoing uncertainties with the COVID-19 pandemic, the short-term outlook over the next fiscal year remains volatile. There are material expenditure pressures in addition to the pandemic response that will require a focused whole-of-government effort led through central planning and prioritization.
By effectively implementing public policies to meet budget targets, Manitoba achieved a surplus budget balance in 2019/20—the first in 11 years. Due to COVID-19, the net income anchor was reset at the baseline level of $2.117 billion in 2020/21 and requires a return to balance by 2028/29.
|
Annual Net Income (Loss) |
||||||||||
|
2013/
|
2014/
|
2015/
|
2016/
|
2017/
|
2018/
|
2019/
|
2020/
|
2021/
|
2022/
|
|
|
Millions of Dollars |
||||||||||
|
Total Revenue |
14,336 |
14,801 |
14,916 |
15,627 |
16,152 |
17,028 |
17,641 |
17,819 |
18,692 |
19,553 |
|
Total Expenditures |
14,936 |
15,340 |
15,848 |
16,416 |
16,846 |
17,177 |
17,636 |
19,936 |
20,085 |
19,901 |
|
Planning Contingencies |
(200) |
|||||||||
|
Summary Net Income (Loss) |
(600) |
(539) |
(932) |
(789) |
(694) |
(149) |
5 |
(2,117) |
(1,393) |
(548) |
|
Annual Net Income (Loss) to Provincial GDP (%) |
(1.0) |
(0.8) |
(1.4) |
(1.2) |
(1.0) |
(0.2) |
0.0 |
(2.9) |
(1.7) |
(0.6) |
|
f - Forecast b - Budget Source: Manitoba Finance |
||||||||||
Net debt as a share of provincial GDP
Net debt represents accumulated financial obligations for the government. It indicates the level of future revenue requirements to pay for past transactions or events. It is also a measure of the affordability of additional government spending.
Responsible management of investment in tangible and non-financial capital assets, combined with a gradual return to balance in 2019/20, meant that the rate of growth in Manitoba’s debt substantially slowed.
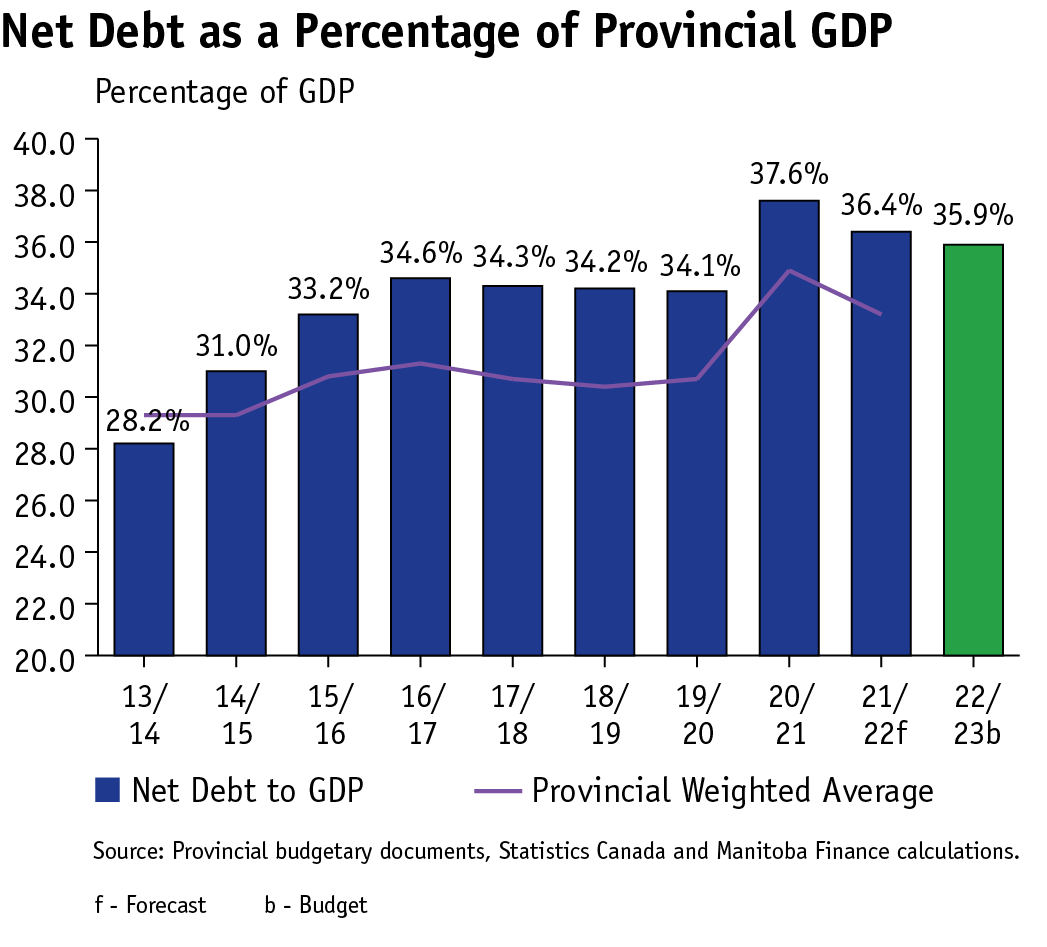
Between 2016/17 and 2019/20, Manitoba’s net debt slowed to a 3.6 per cent annual growth rate compared to a 10.9 per cent annual growth in the previous four years. The annual deficits totalled $1.627 billion during this period.
Reflecting pandemic borrowing, net debt to GDP increased to 37.6 per cent in 2020/21 compared to 34.1 per cent in 2019/20, the lowest in four years. Taking a responsible approach, net debt-to-GDP is expected to decline to 36.4 per cent in 2021/22 and to 35.9 per cent in 2022/23. The fiscal indicator goal for net debt-to-GDP is to be in line with the weighted average for Canadian provinces.
Flexibility Indicator
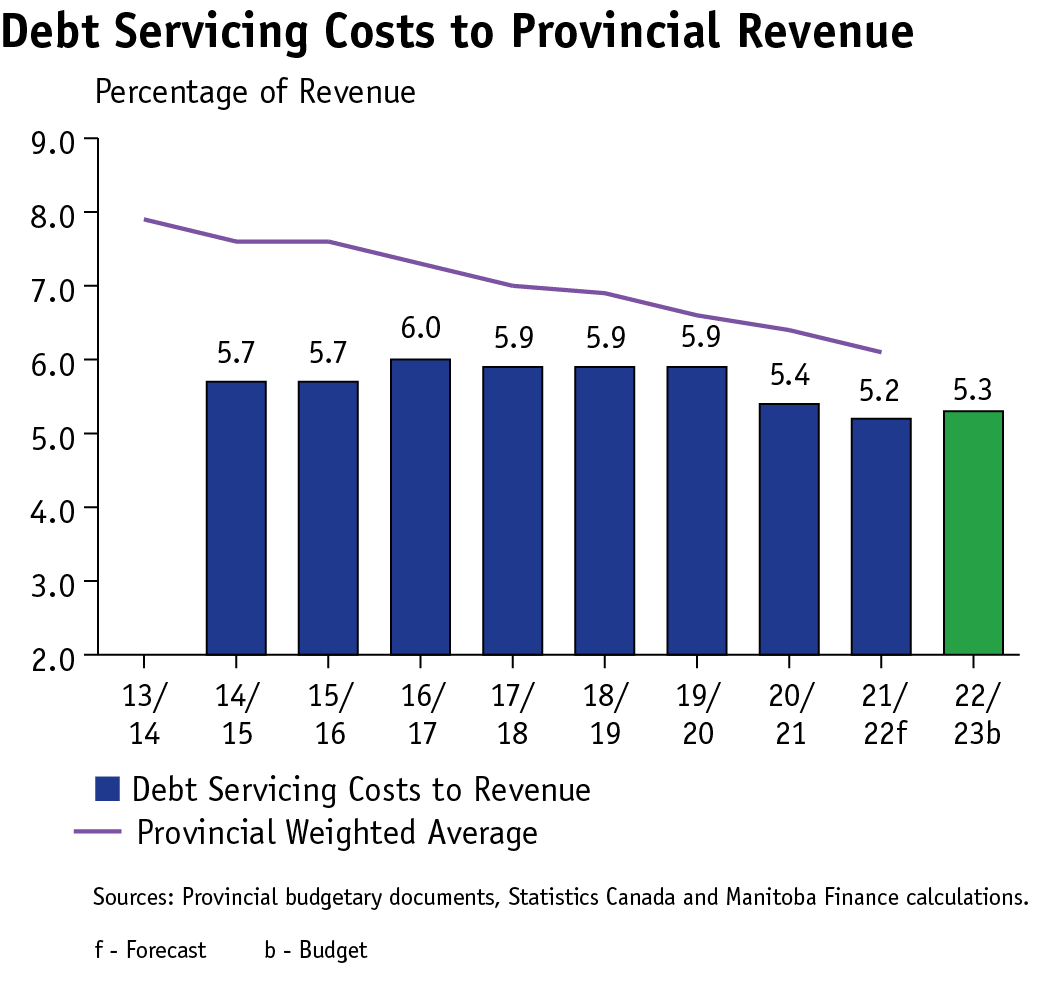
Public Debt Charges-to-Total Revenue
Cost of servicing Manitoba’s debt as a percentage of total revenue is a measure of flexibility. It shows the extent to which a government must use revenue to pay interest and other debt servicing costs rather than provide services or programs.
Interest rates have nowhere to go, but up. The Bank of Canada raised the trend-setting rate by 25 basis points in March 2022, the first time since 2018, and after keeping it near zero for nearly two years of the pandemic. More interest rate increases are expected.
Rising interest rates will pressure flexibility. According to Manitoba’s Debt Management Strategy, every one-percentage point increase in interest rates, for an entire year, will result in an estimated increase in debt servicing costs of $49 million.
The graph shows that in 2016/17, the Manitoba government used six cents of every dollar of revenue to pay interest on the public debt. In 2020/21, 5.4 cents of every dollar of revenue was used to pay interest.
The public debt charges to revenue fiscal indicator demonstrates that flexibility improved as more total revenue was available for current needs today than it did in 2016/17. The target anchor for debt charges to total revenue is to remain below the provincial weighted average.
Vulnerability Indicator:
Federal Transfers to Total Revenue
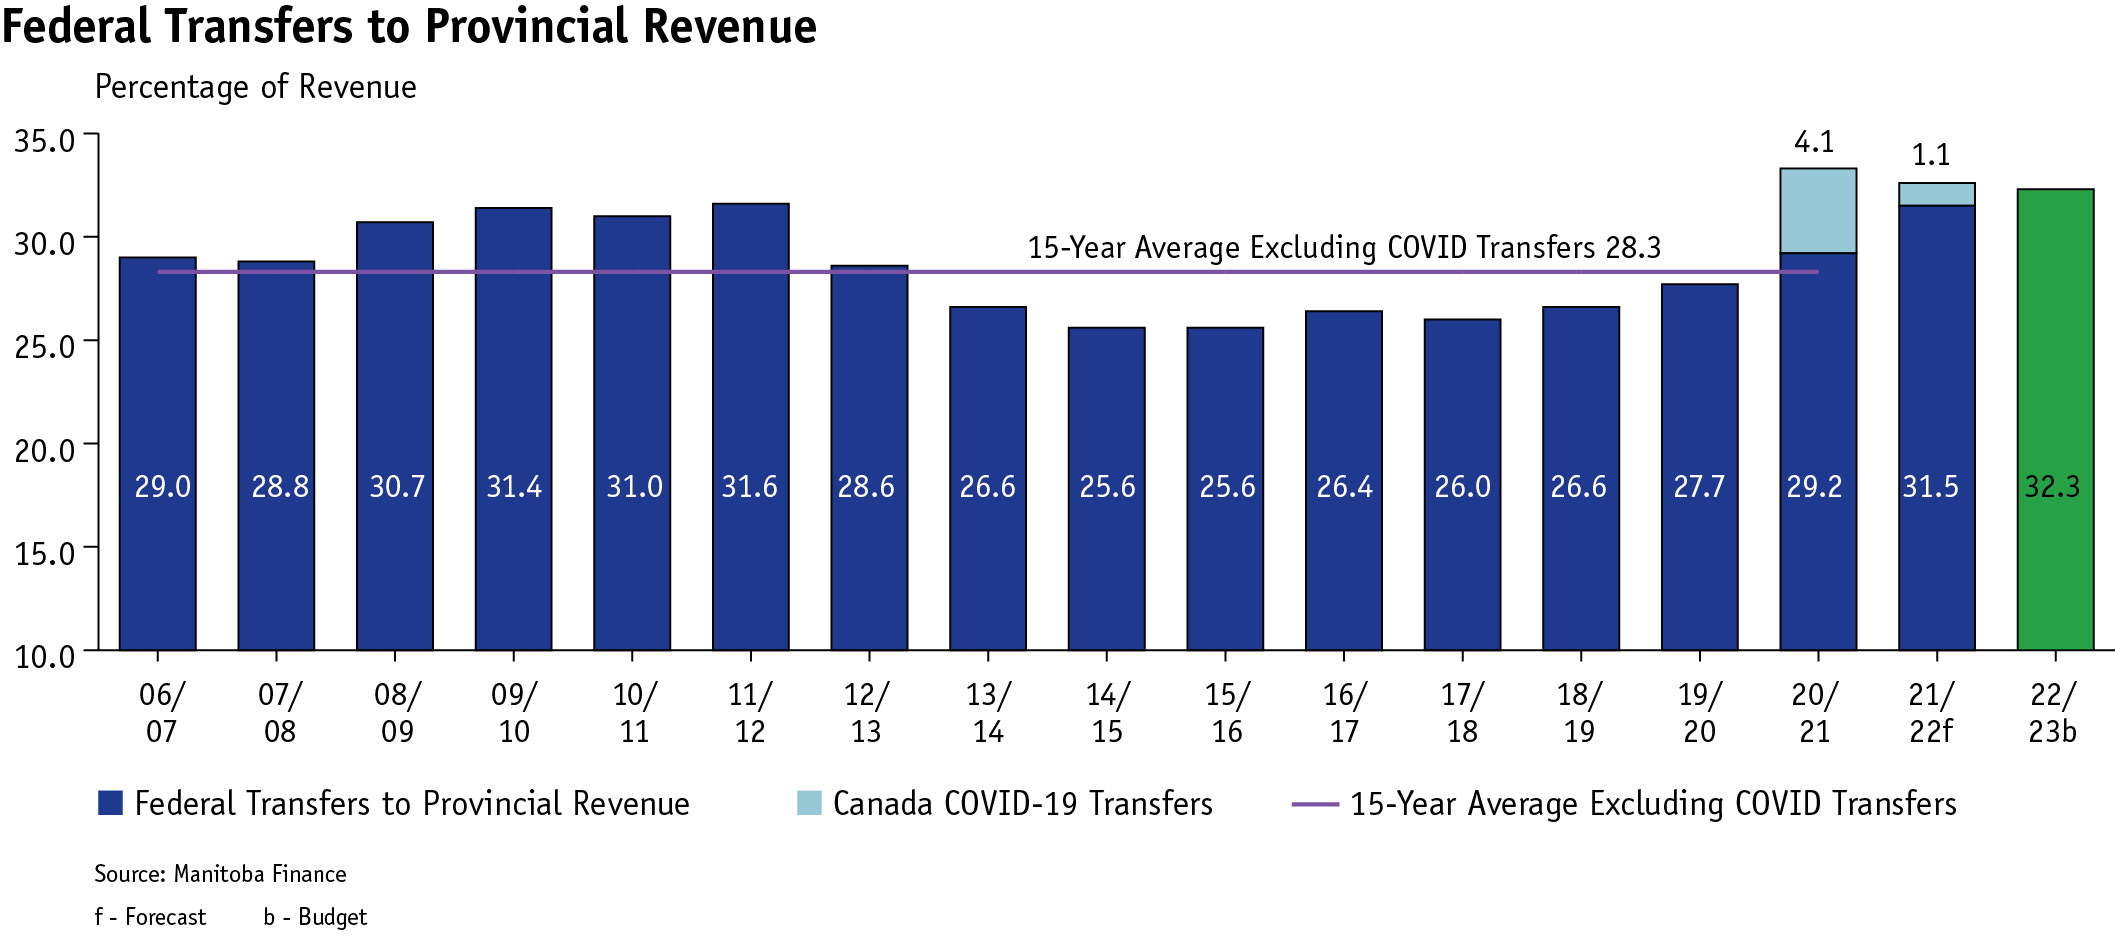
The ratio of federal transfers to total revenue measures the vulnerability of provinces to changes in transfers from the Government of Canada.
Vulnerability is the extent to which a government is dependent upon sources of revenue outside of its control or influence.
The graph shows the ratio of major federal transfers and related transfers to total provincial revenue has increased from 29 per cent in 2006/07 to 33.3 per cent in 2020/21 (including COVID-19 related transfers). Excluding COVID-19 related transfers, the ratio is estimated at 29.2 per cent for 2020/21.
Overall, Manitoba saw a decline in federal transfers as a share of total revenues from a high of over 31.6 per cent in 2011/12, as illustrated by the blue bars in the graph. Federal transfers in both 2021/22 and 2022/23 are forecast to be over the historical 15-year average even after adjusting for one-time COVID-19 transfers.
Credit Ratings
Credit rating agencies monitor the government’s progress on the fiscal strategy and assess the credit worthiness of the province and the ability to pay back debt obligations. Investors’ decisions to buy Manitoba bonds are partially based on the credit ratings assigned by rating agencies.Manitoba bonds are rated A+ with stable outlook by Standard and Poor’s, Aa2 stable by Moody’s and A(high) stable by DBRS. Manitoba bonds require a formal rating in order for some investors to consider purchasing.
When evaluating a credit, rating agencies look at such factors as the economy, financial performance, liquidity levels and debt burden. Manitoba ensures rating agencies are continually provided with updated information on the factors used to determine the rating and outlook.
|
Ratings |
|||
|
Moody’s |
S&P |
DBRS |
|
|
British Columbia |
Aaa |
AA+ |
AA(H) |
|
Alberta |
Aa3 |
A |
AA(L) |
|
Saskatchewan |
Aa1 |
AA |
AA(L) |
|
Manitoba |
Aa2 |
A+ |
A(H) |
|
Ontario |
Aa3 |
A+ |
AA(L) |
|
Quebec |
Aa2 |
AA- |
AA(L) |
|
New Brunswick |
Aa2 |
A+ |
A(H) |
|
Nova Scotia |
Aa2 |
AA- |
A(H) |
|
PEI |
Aa2 |
A |
A |
|
Nfld & Labrador |
A1 |
A |
A(L) |