
Demographics and Mortality
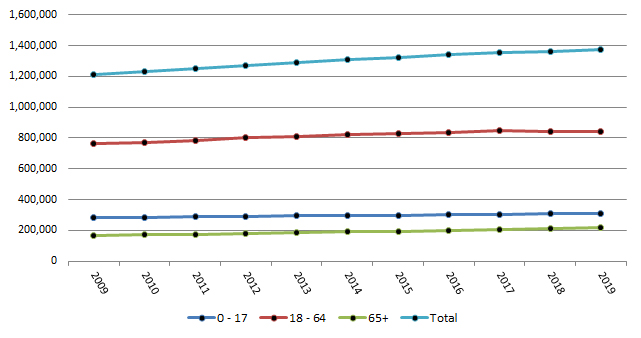
Manitoba Population by Selected Age Groups, as of June 1st
|
2010 |
2011 |
2012 |
2013 |
2014 |
2015 |
2016 |
2017 |
2018 |
2019 |
|
| 0-17 | 286,938 | 290,298 | 292,410 | 293,900 | 295,804 | 298,482 | 302,468 | 306,055 | 307,579 | 309,989 | |
| 18-64 | 773,097 | 786,638 | 800,020 | 810,924 | 820,841 | 827,474 | 836,975 | 845,418 | 841,489 | 843,943 | |
| 65+ | 170,235 | 173,548 | 178,958 | 184,444 | 189,664 | 194,387 | 199,865 | 205,488 | 211,450 | 218,776 | |
| Total | 1,230,270 | 1,250,484 | 1,271,388 | 1,289,268 | 1,306,309 | 1,320,343 | 1,339,308 | 1,356,961 | 1,360,518 | 1,372,708 | |
Births
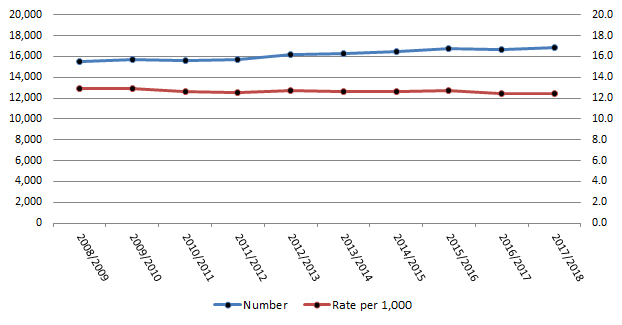
Number of Live Births and Rate per 1,000 Manitoba Residents
| 2008/ 2009 |
2009/ 2010 |
2010/ 2011 |
2011/ 2012 |
2012/ 2013 |
2013/ 2014 |
2014/ 2015 |
2015/ 2016 |
2016/ 2017 |
2017/ 2018 |
||
| Number | 15,483 | 15,743 | 15,588 | 15,732 | 16,207 | 16,292 | 16,469 | 16,760 | 16,617 | 16,803 | |
| Rate per 1,000 | 12.9 | 13.0 | 12.7 | 12.6 | 12.7 | 12.6 | 12.6 | 12.7 | 12.4 | 12.4 | |
Deaths
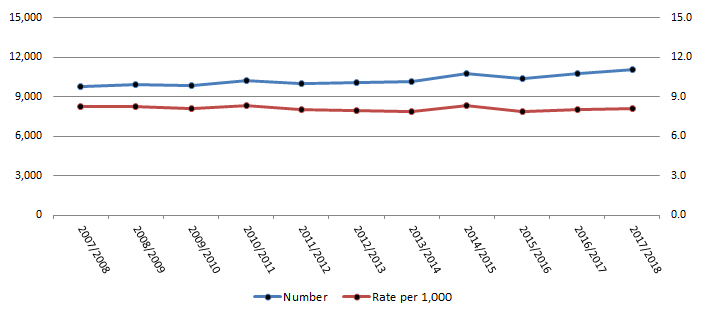
Number of Deaths and Rate per 1,000 Manitoba Residents
| 2008/ 2009 |
2009/ 2010 |
2010/ 2011 |
2011/ 2012 |
2012/ 2013 |
2013/ 2014 |
2014/ 2015 |
2015/ 2016 |
2016/ 2017 |
2017/ 2018 |
||
| Number | 9,895 | 9,822 | 10,210 | 10,002 | 10,061 | 10,129 | 10,779 | 10,377 | 10,764 | 11,058 | |
| Rate per 1,000 | 8.3 | 8.1 | 8.3 | 8.0 | 7.9 | 7.9 | 8.3 | 7.9 | 8.0 | 8.1 | |
Any inquiries pertaining to these quick stats should be addressed to: Information Management & Analytics |