Agricultural Climate of Manitoba
This reference tool is for agricultural producers and agribusiness. Using a series of maps, it describes the agricultural climate of Manitoba, based on the climate in the region over a 60 year period (1929 to 1988).
The agro-climatic information in this publication has certain limitations. First, some climate stations do not completely represent the regions they monitor. Such is the case when a climate station is located in a river valley and farmland is on the adjacent plain.
Next, the length of record varies from station to station. To maximize the geographical detail, stations with a minimum of 20 years of records have been used.
Finally, the density of stations determines the extent of the regions on all the agro-climatic maps. Figure 1 shows the climatic stations used to prepare these maps. With an average distance of about 50 km between stations, the maps present climatic information on a regional scale.
Heat
Spring Frosts, Fall Frosts and Frost-Free Periods
Frost occurs at temperatures of 0° C or colder. Manitoba is located near the northern limit for agricultural production and as a result the occurrence of frost is one of the most limiting factors for crop development. Unusually late spring frosts or early fall frosts can have serious economic consequences.
The average date of the last spring frost is particularly important because it determines the date of planting. In addition, a late spring frost can do serious damage to young plants. The date of the first fall frost determines the end of the growing season for most crops.
A particularly important period is the time between the last spring frost and the first fall frost, defined as frost-free period. This is the time available for crop production.
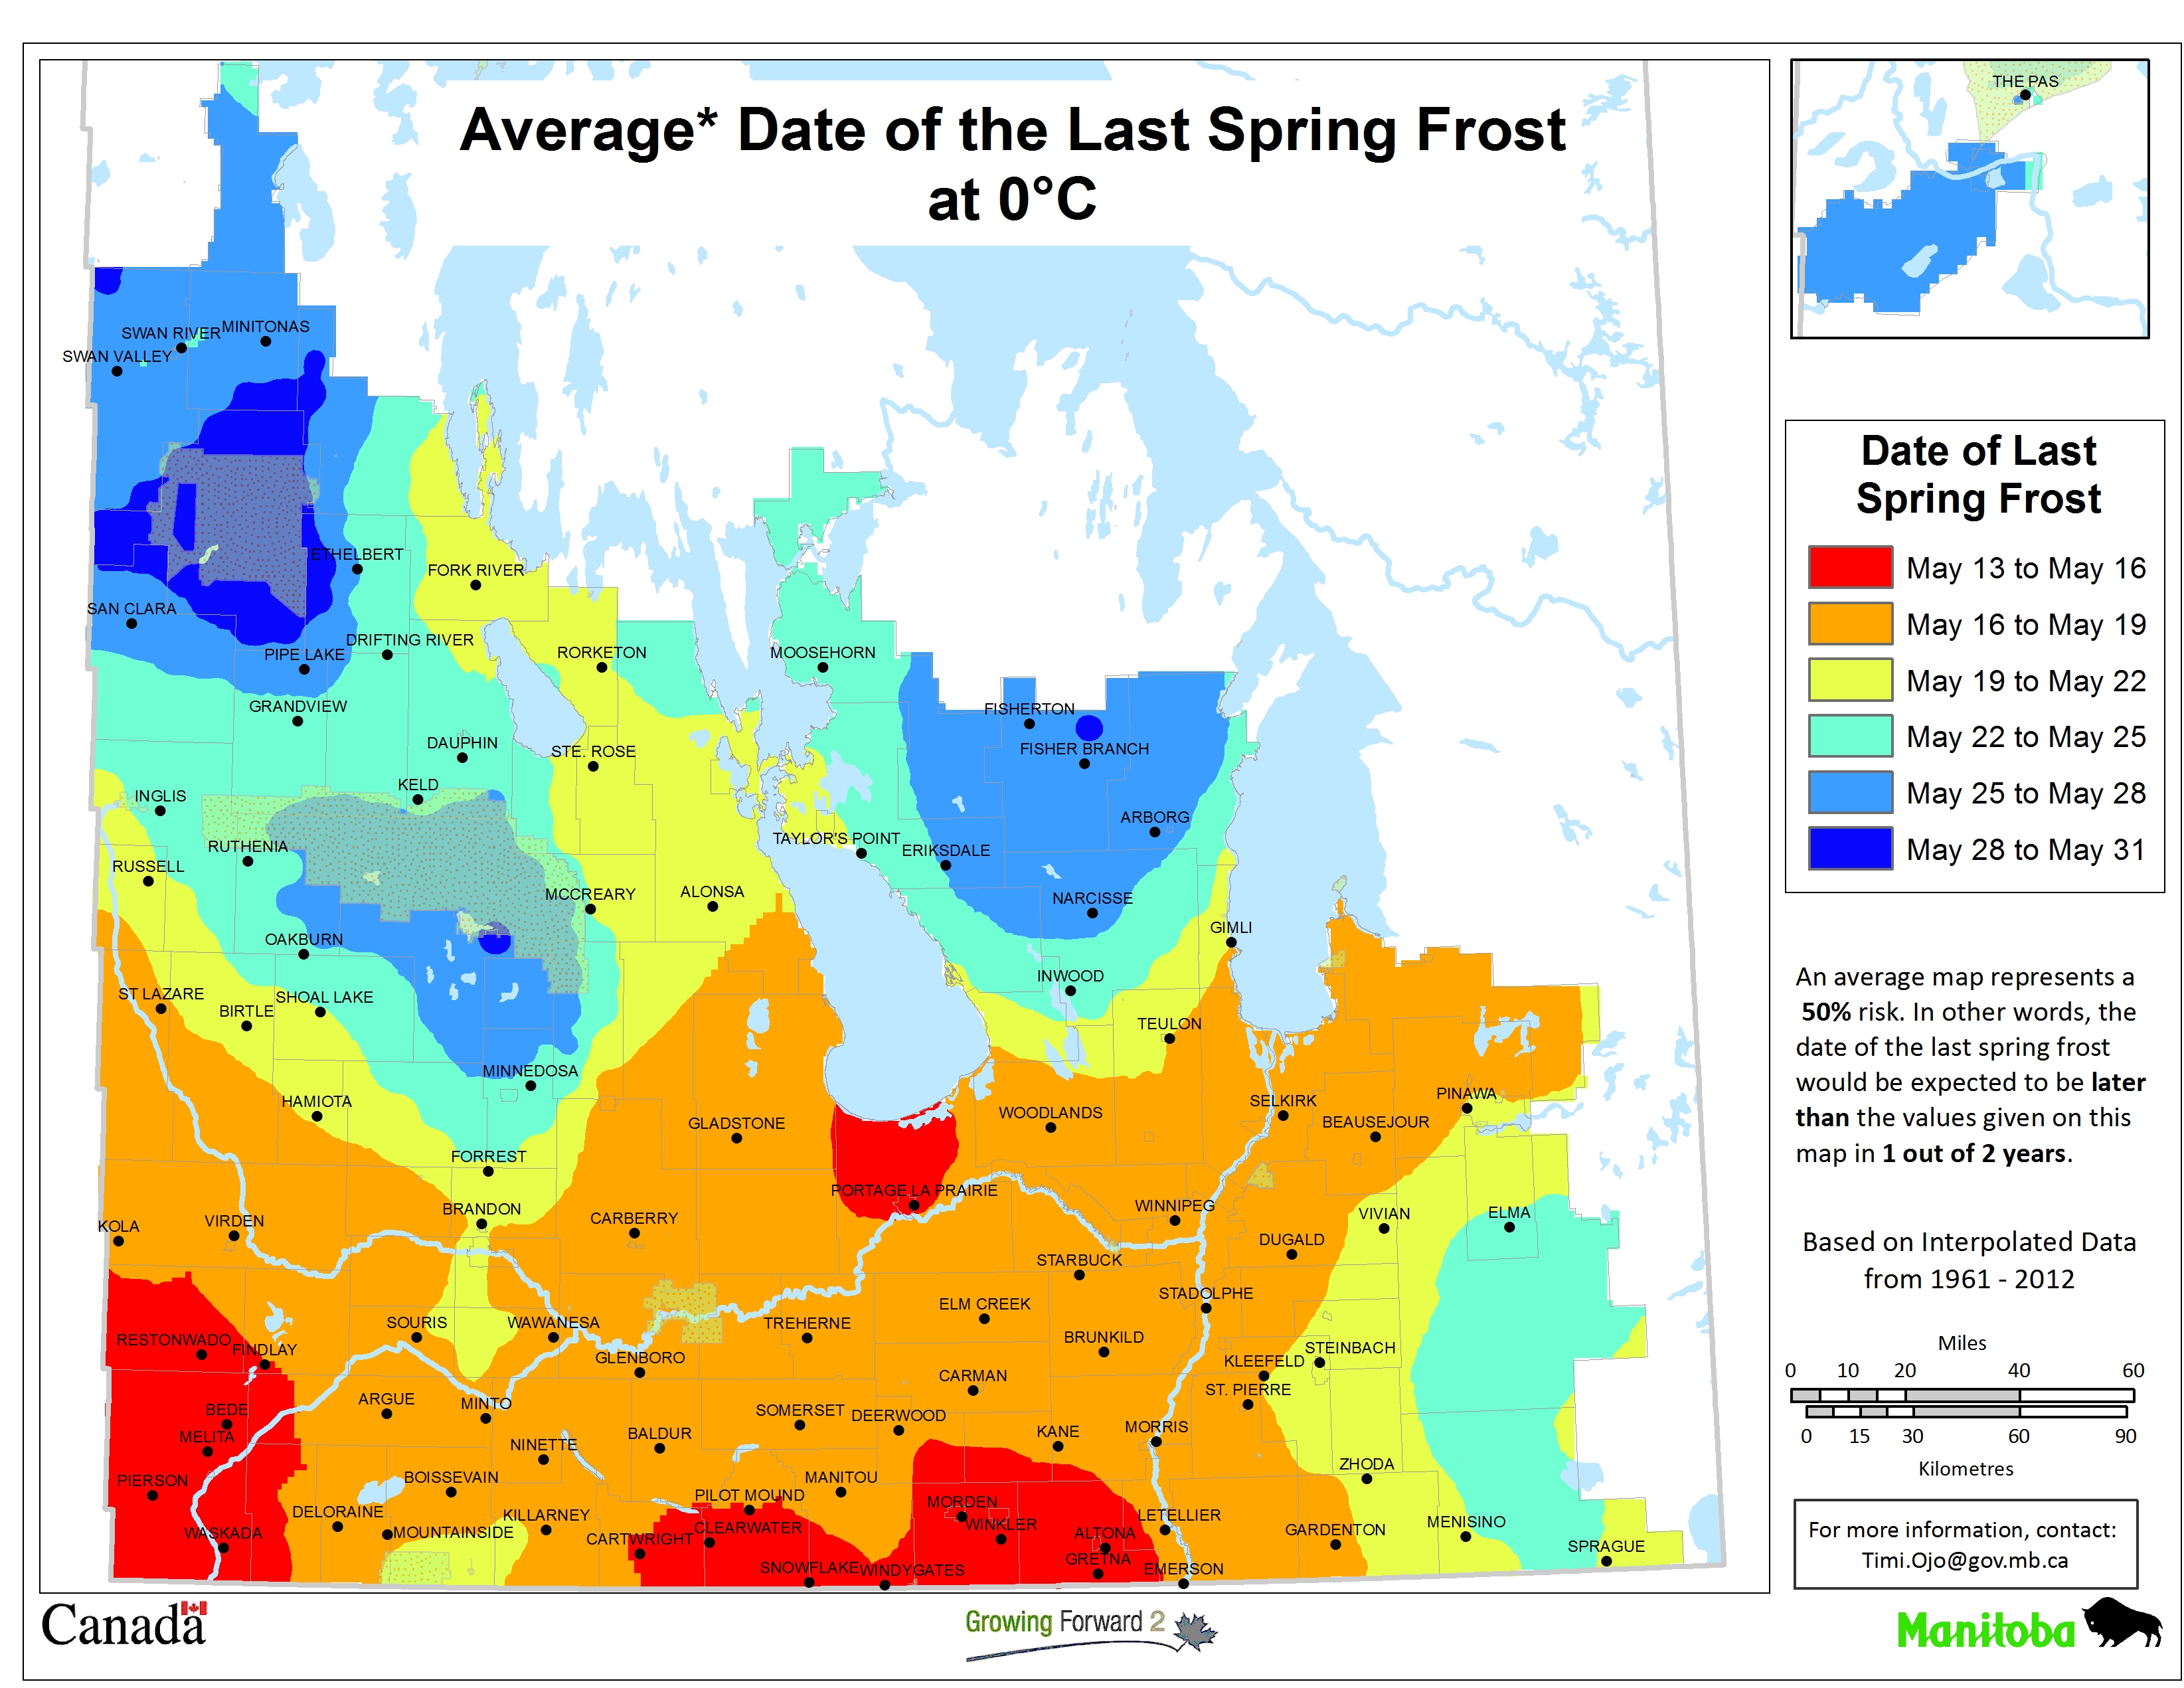
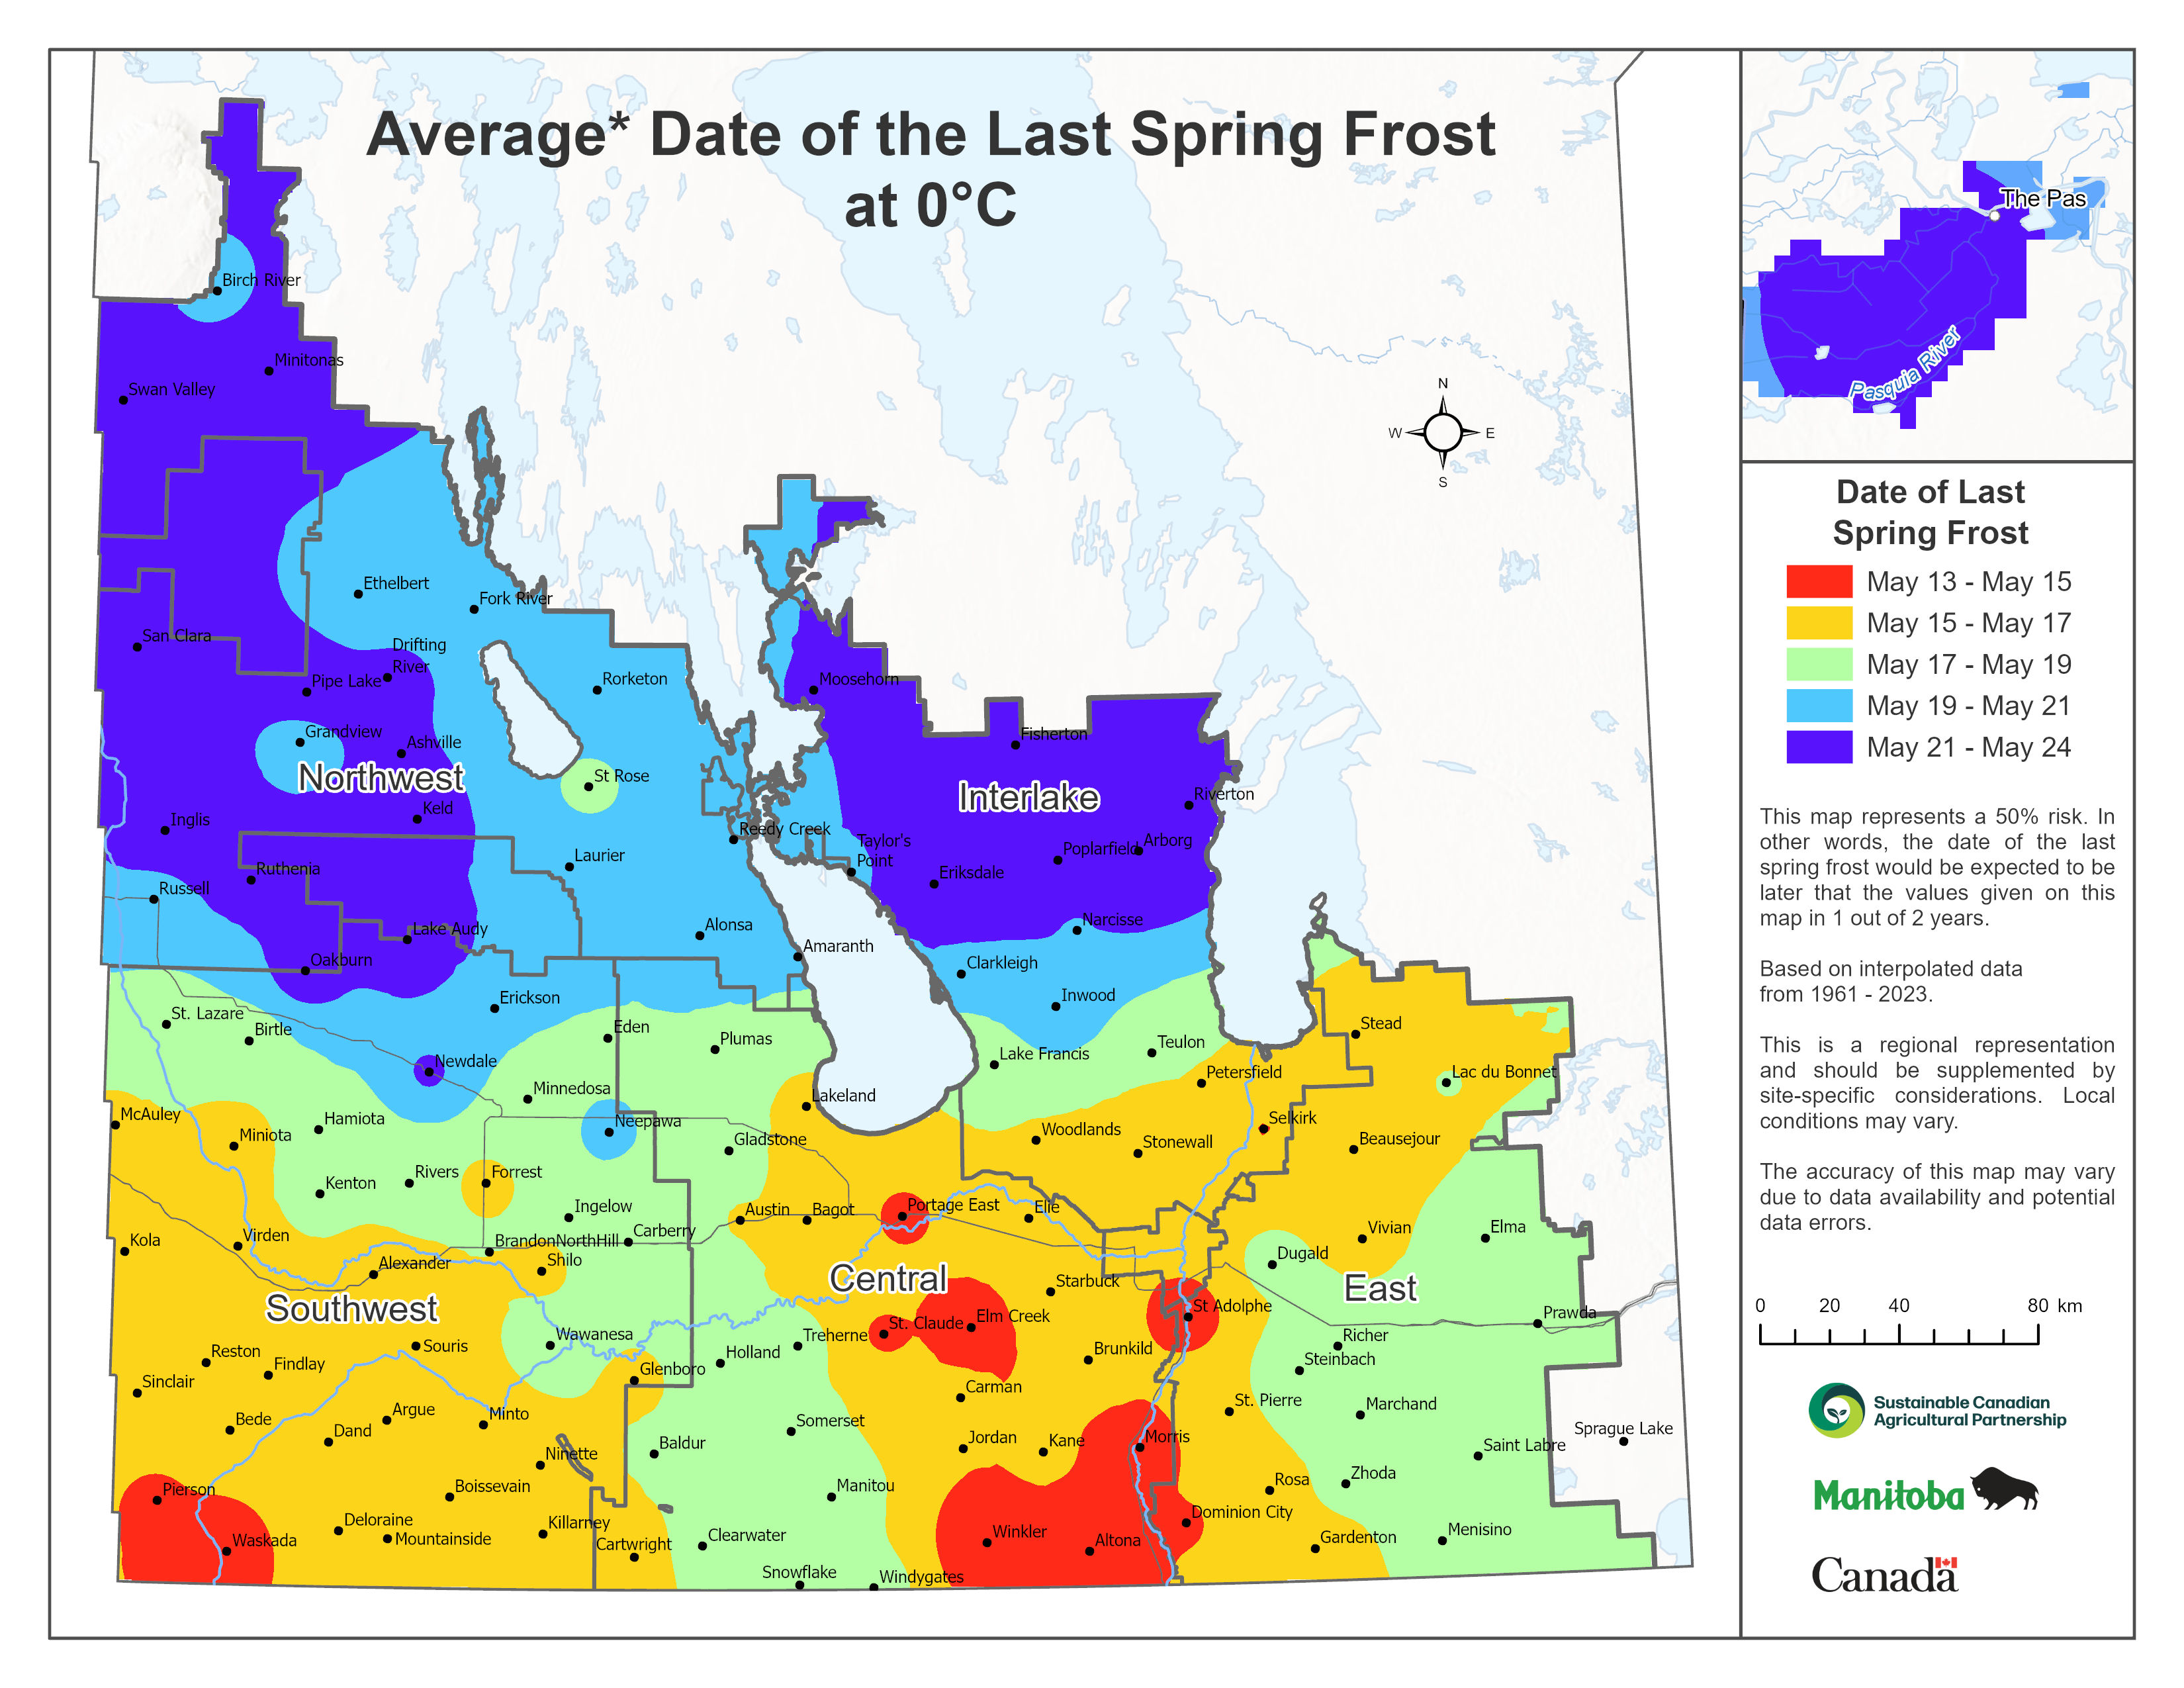
Spring Frosts
The average date (50 percent chance of occurrence) of the last spring frost shows that two regions within Manitoba have the most favourable conditions for early planting (Figure 2). After May 13 there is less than a 50 percent chance of frost in the following regions; Portage la Prairie and Elm Creek; Morris, Morden and Altona; Pierson and Waskada regions. In most other areas of Manitoba, the last spring frost occurs, on average, after May 15. On higher elevations above the Manitoba escarpment, the average date of the last spring frost is somewhat later. The central Interlake and the norttwest regions of Manitoba can expect frost during the after May 21 in one out of every two years.
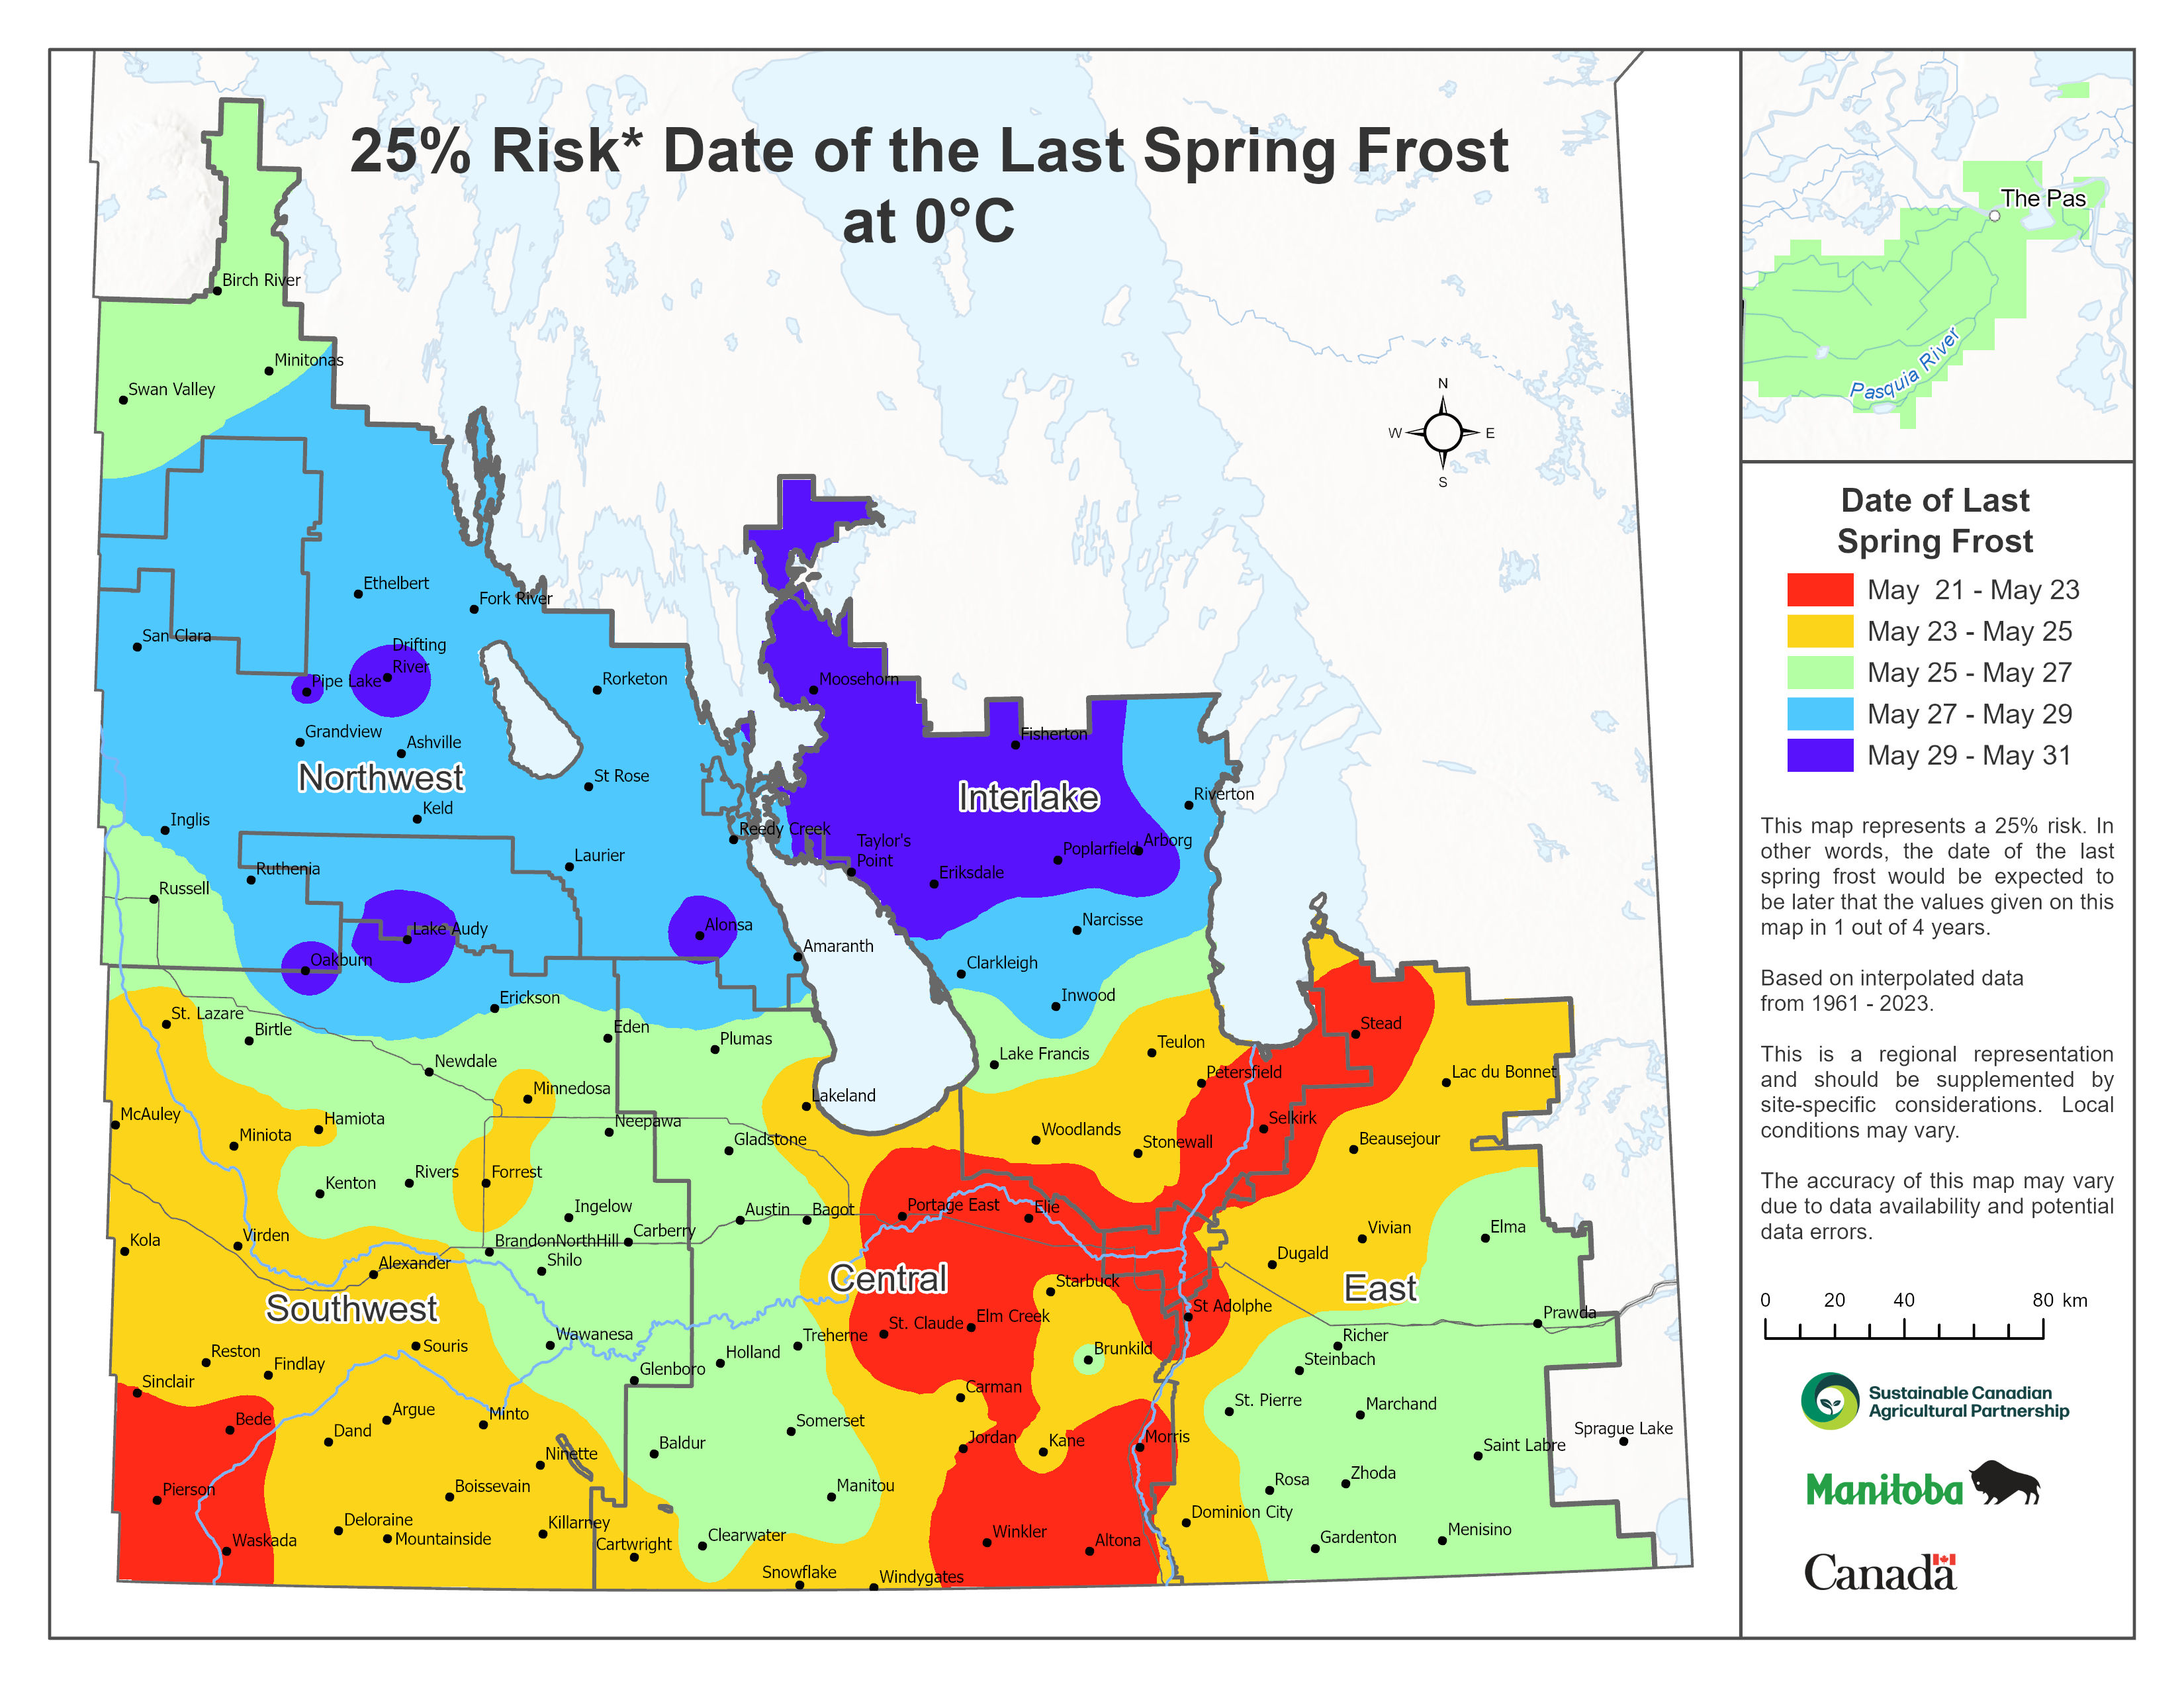
The one-in-four-year risk map (Figure 3) shows a similar geographical pattern, but the last spring frost occurs about eight days later than average. This means there is a 25 percent risk that the last spring frost will occur after May 21 in parts of the central regions, the far southwest region, and areas south of Lake Winnipeg. In most other regions of Manitoba, one in four years has a spring frost around May 25 or later.
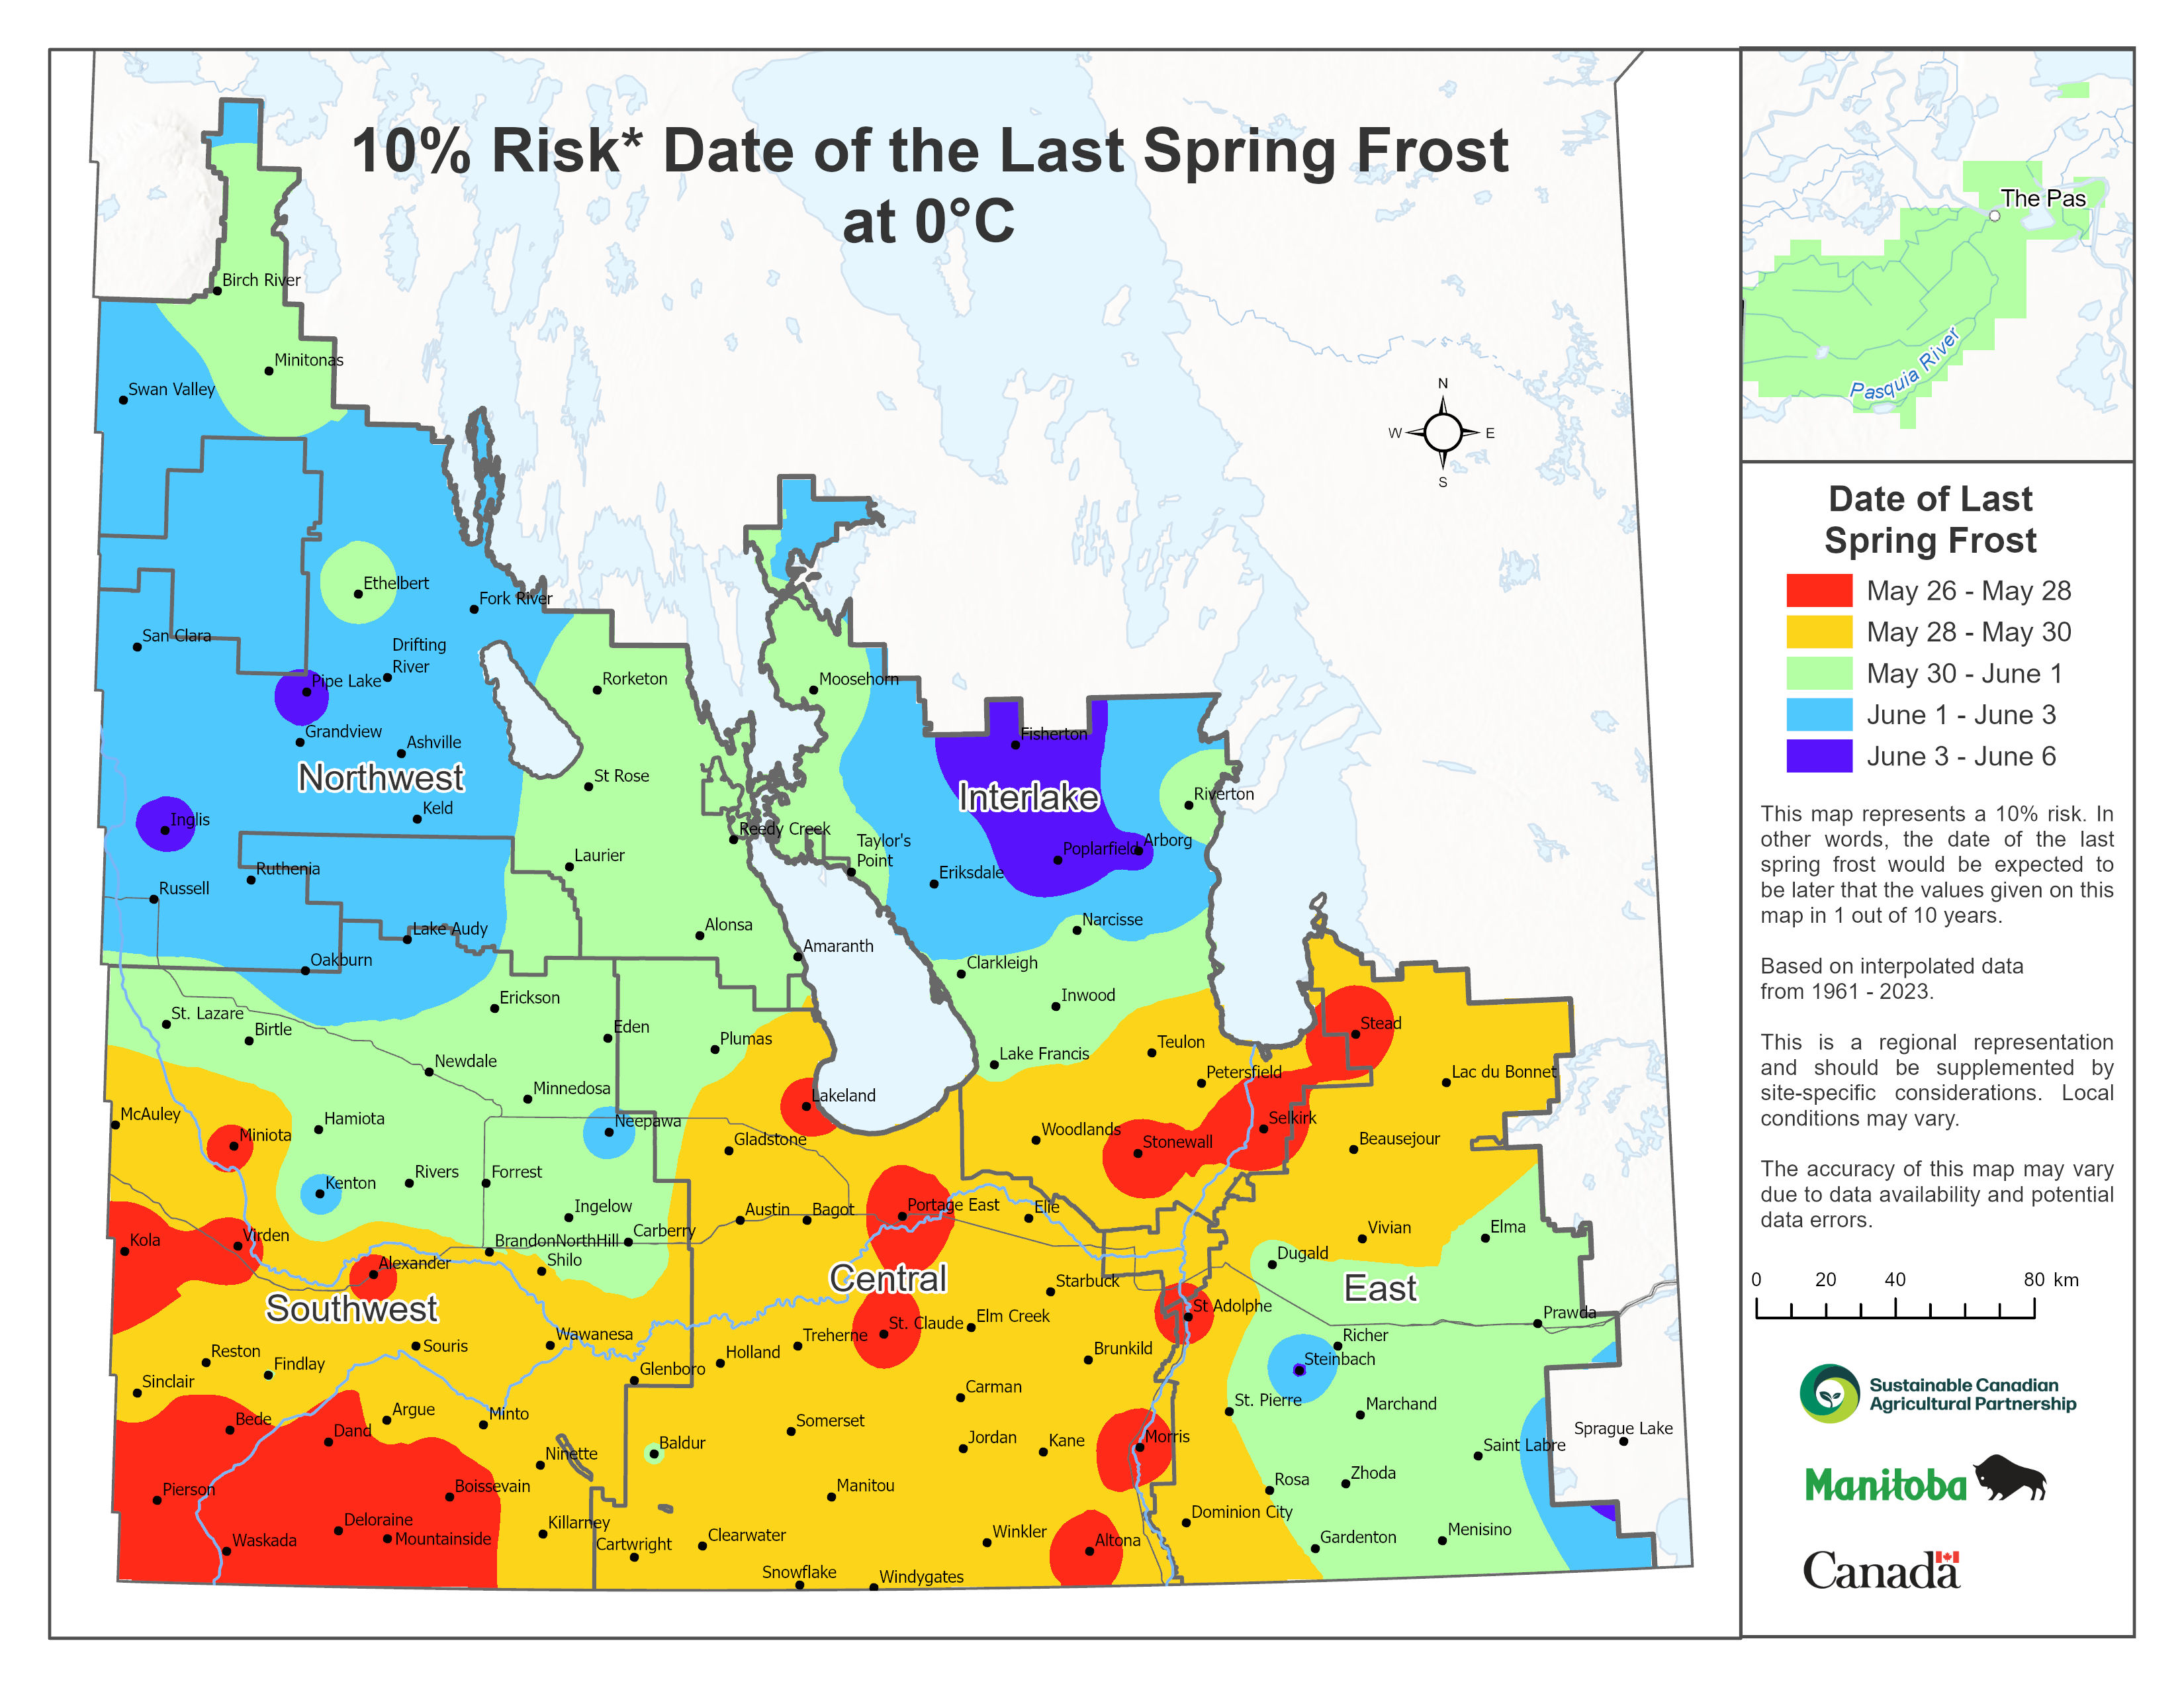
At the 10 percent risk level (the one-in-10-year occurrence), the last spring frost occurs later than May 28 in most regions (Figure 4).
Fall Frosts
Areas susceptible to late spring frost also risk an early fall frost (Figure 5). The earliest average first fall frosts (September 17 to 23) are in the Riding Mountain and northeast regions of Manitoba.
Likewise, the latest occurrence of first fall frosts (from September 26 to October 4) are in those areas with the earliest occurrence of last spring frosts. These regions are the Central region and the north-east portion of agro-Manitoba.
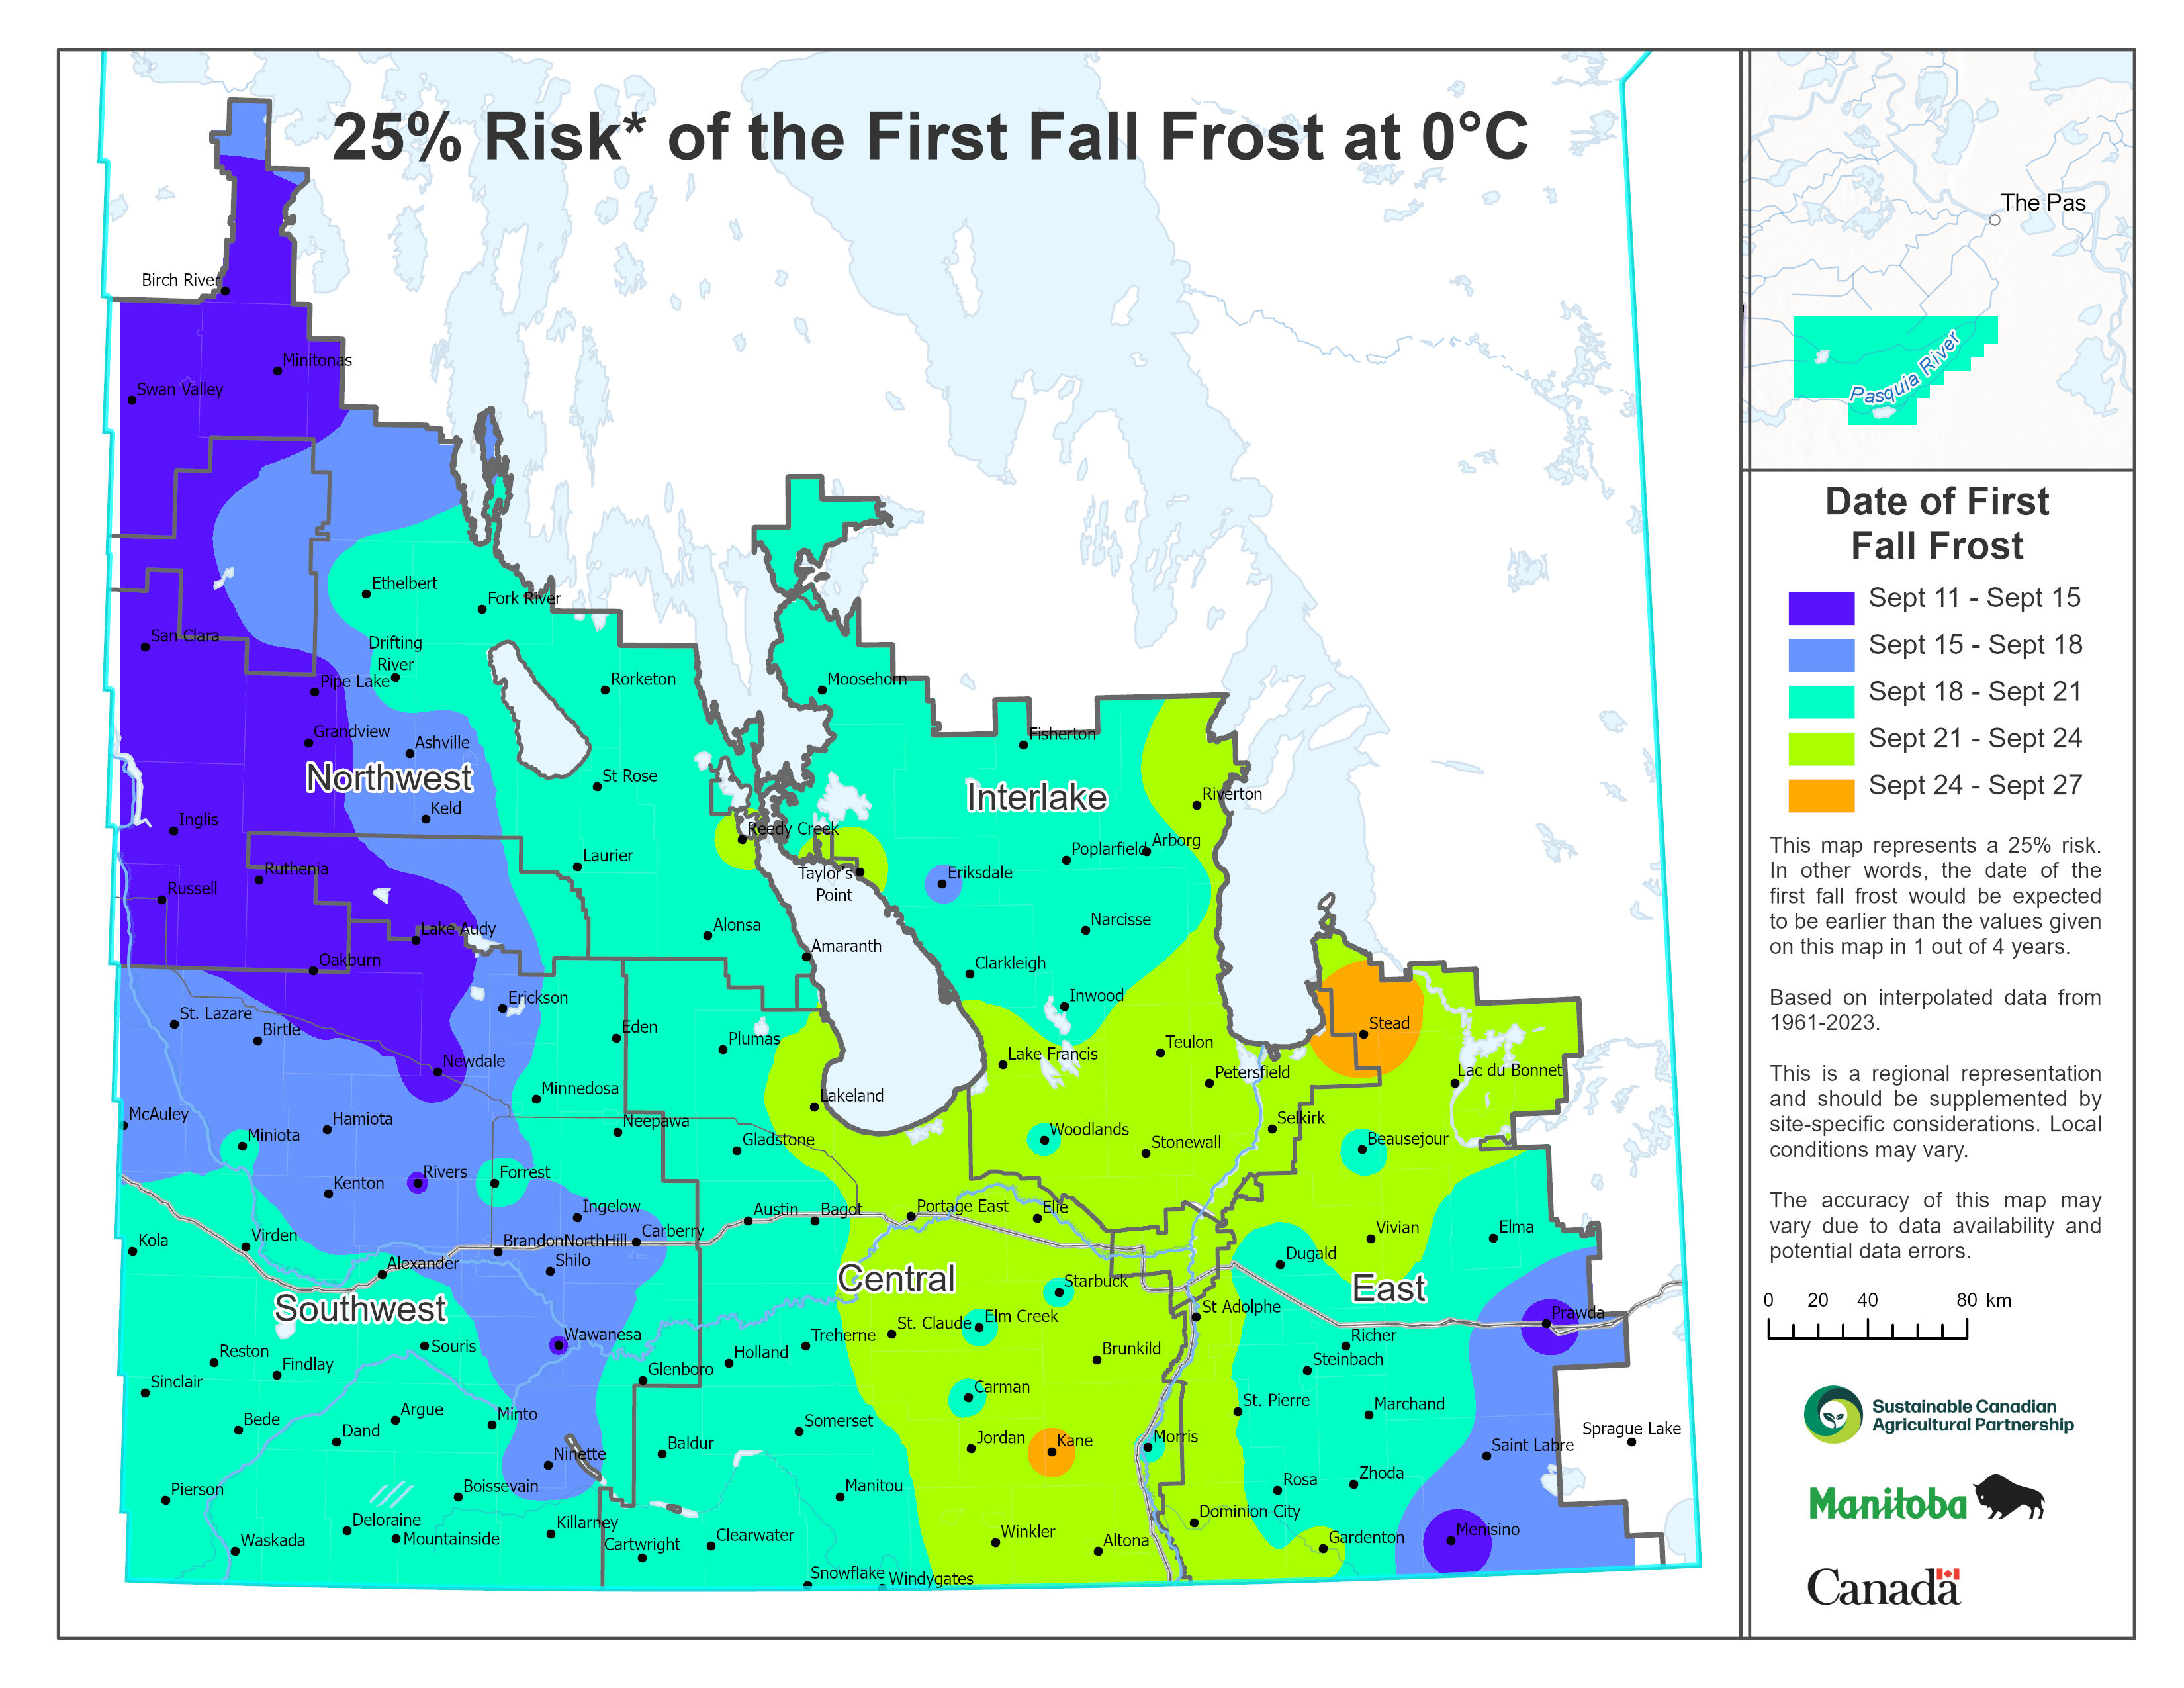
Maps showing the date of the first fall frost at 25 percent and 10 percent risk levels show a geographic pattern similar to that revealed by the map of average dates. At 25 percent risk, or a one-in-four-year occurrence, the first fall frosts range from September 11 to September 27 in agro-Manitoba (Figure 6). For the 10 percent risk, or a one-in-10-year occurrence, the dates of the first fall frosts range from September 7 to September 22 (Figure 7).
Frost-Free Periods
The frost-free period determines the time available for crop production. As such, it also determines what crops can be grown in a region. Table 1 shows the number of days required for selected crops to reach maturity.
Table 1: Number of Days Required for Selected Crops to Reach Maturity
| Crop | Days to Maturity |
| Barley | 60 - 90 |
| Canola - early Polish | 73 - 83 |
| Buckwheat | 80 - 90 |
| Yellow Mustard | 80 - 90 |
| Oats | 85 - 88 |
| Brown or Oriental Mustard | 85 - 95 |
| Flax | 85 - 100 |
| Lentils | 85 - 100 |
| Coriander | 90 - 100 |
| Field Peas | 90 - 100 |
| Navy Beans | 90 - 100 |
| Wheat | 90 - 100 |
| Canola - late Argentine | 92 - 102 |
| Black Beans | 95 - 105 |
| Canary Grass Seed | 95 - 105 |
| Fababeans | 105 - 115 |
| Corn (Grain) | 110 - 120 |
| Potatoes | 110 - 140 |
| Sunflowers | 120 - 130 |
| Sugar Beets | 120 - 140 |
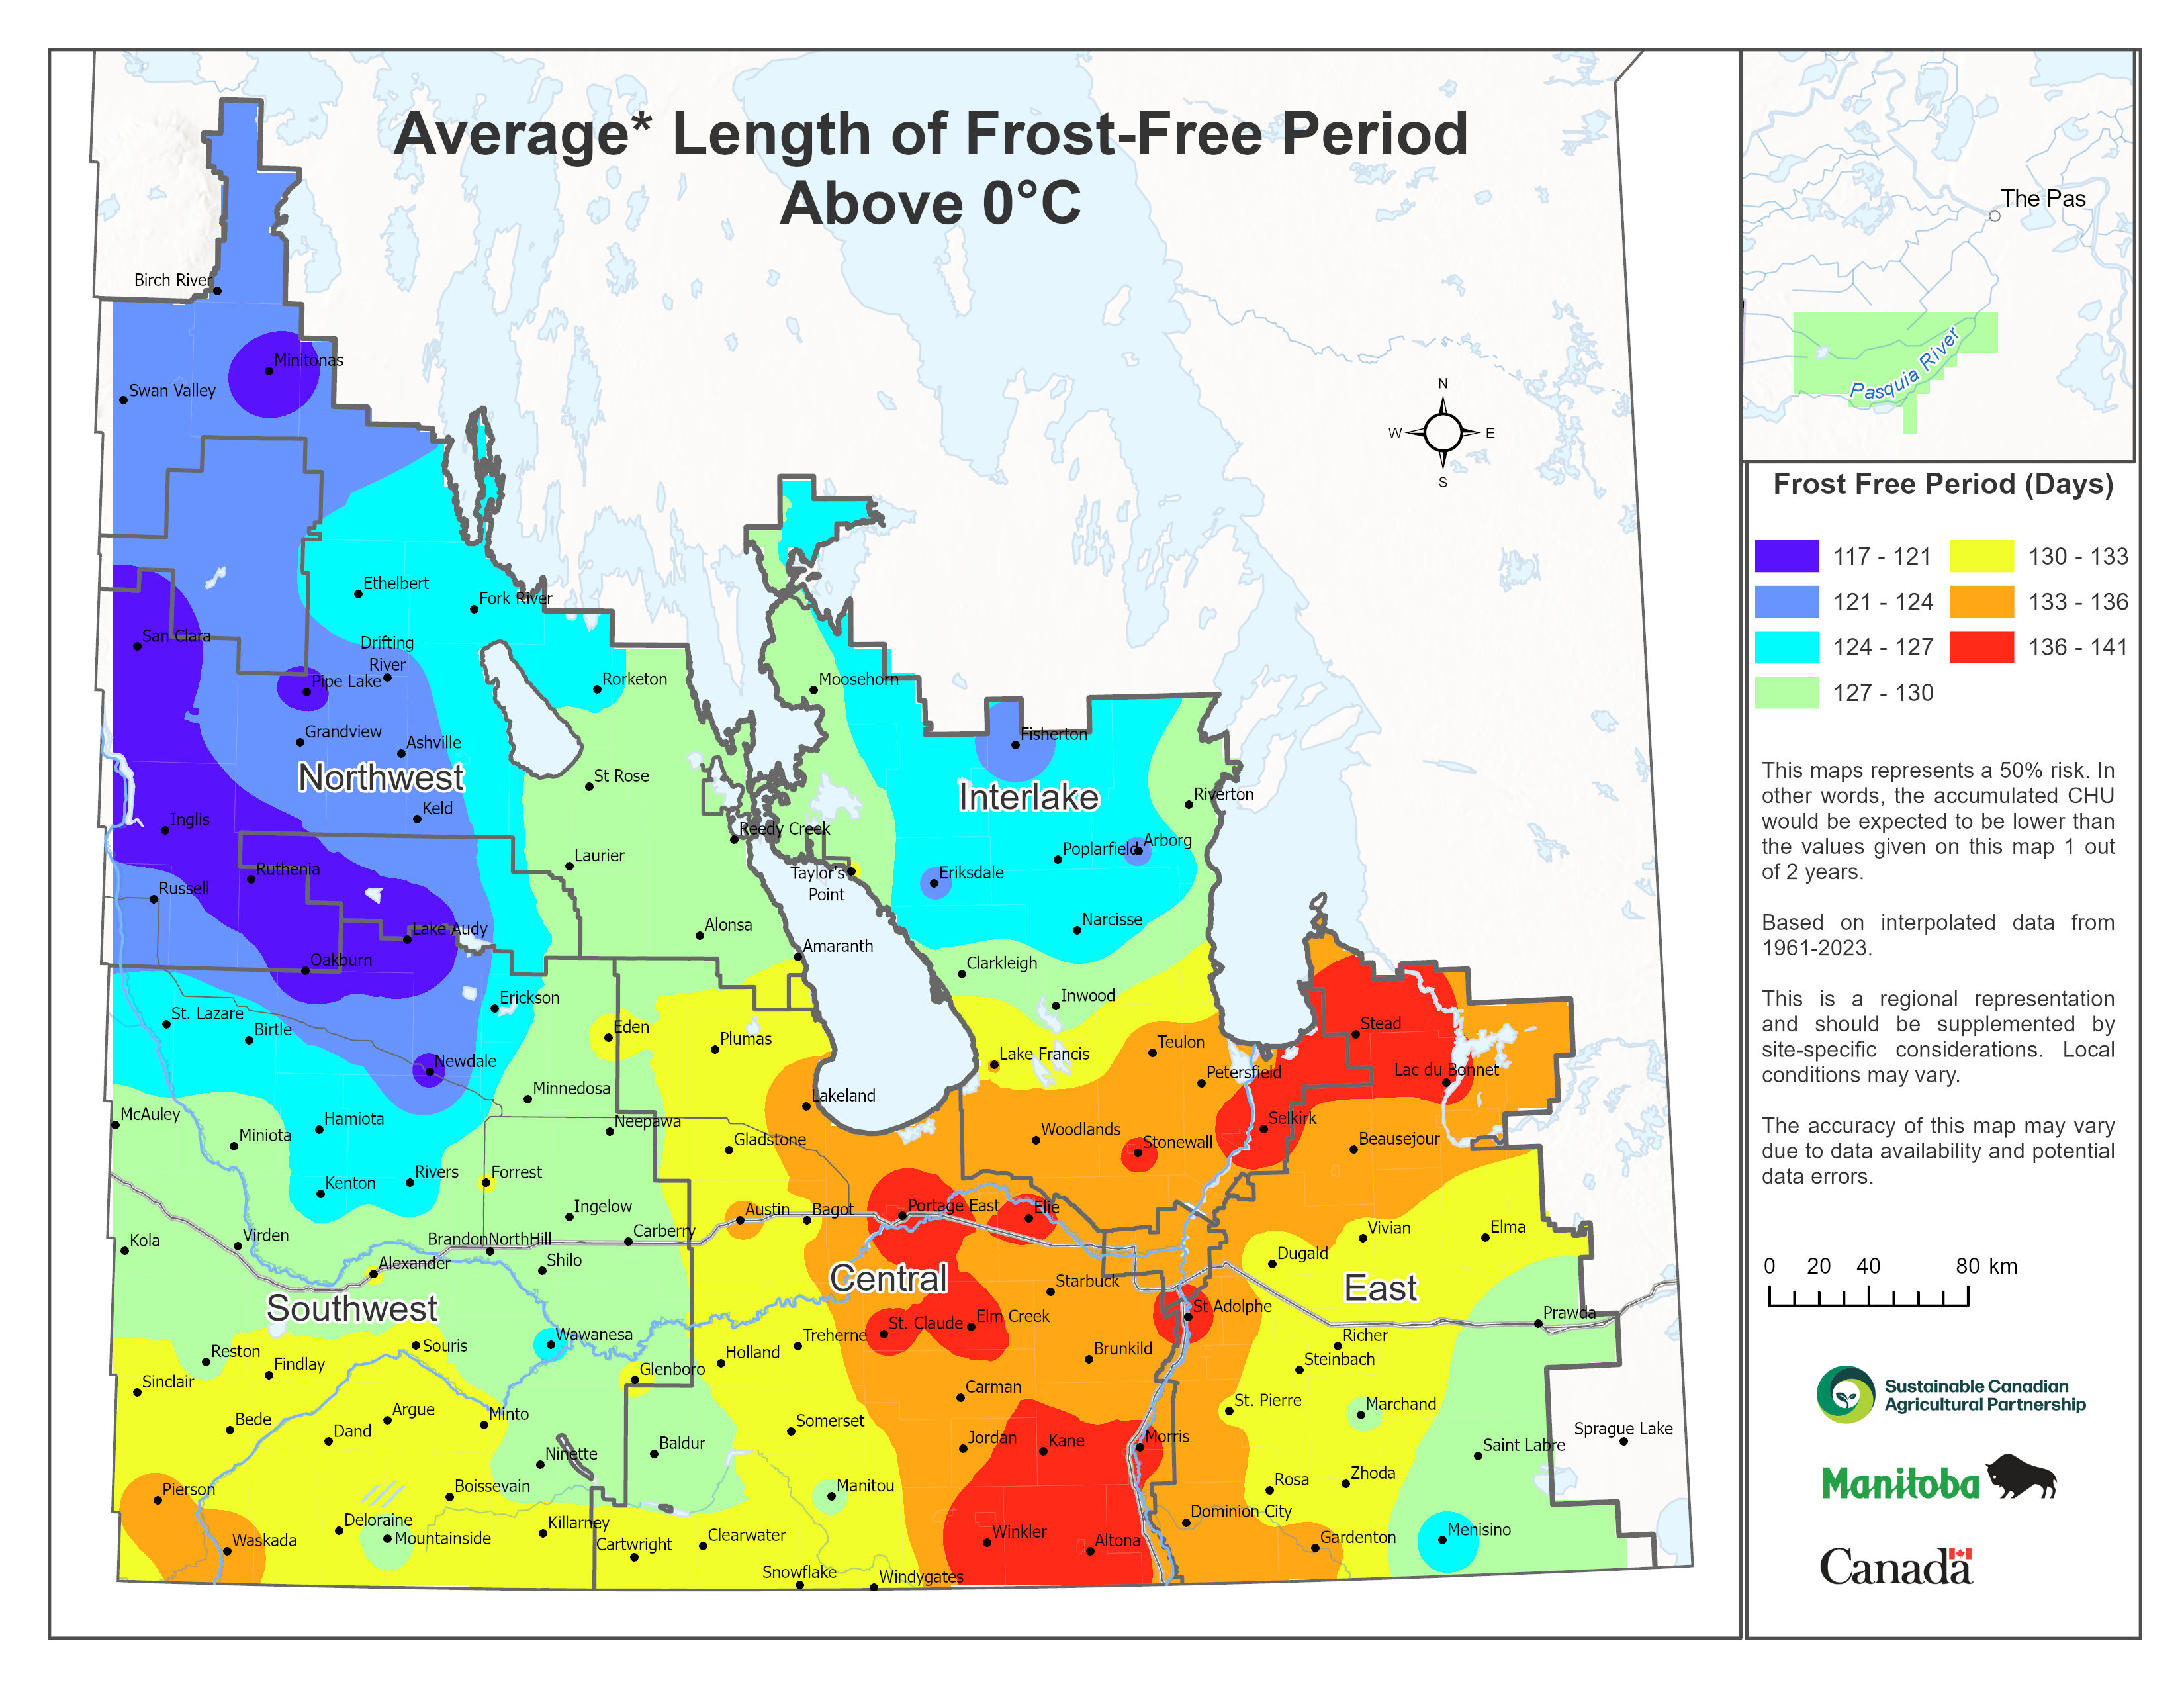
The average frost-free period is the shortest near Riding Mountain at 117-121 days (Figure 8). The longest average frost-free period (136 to 141 days) is in the Morden, Portage la Prairie, and Selkirk areas.
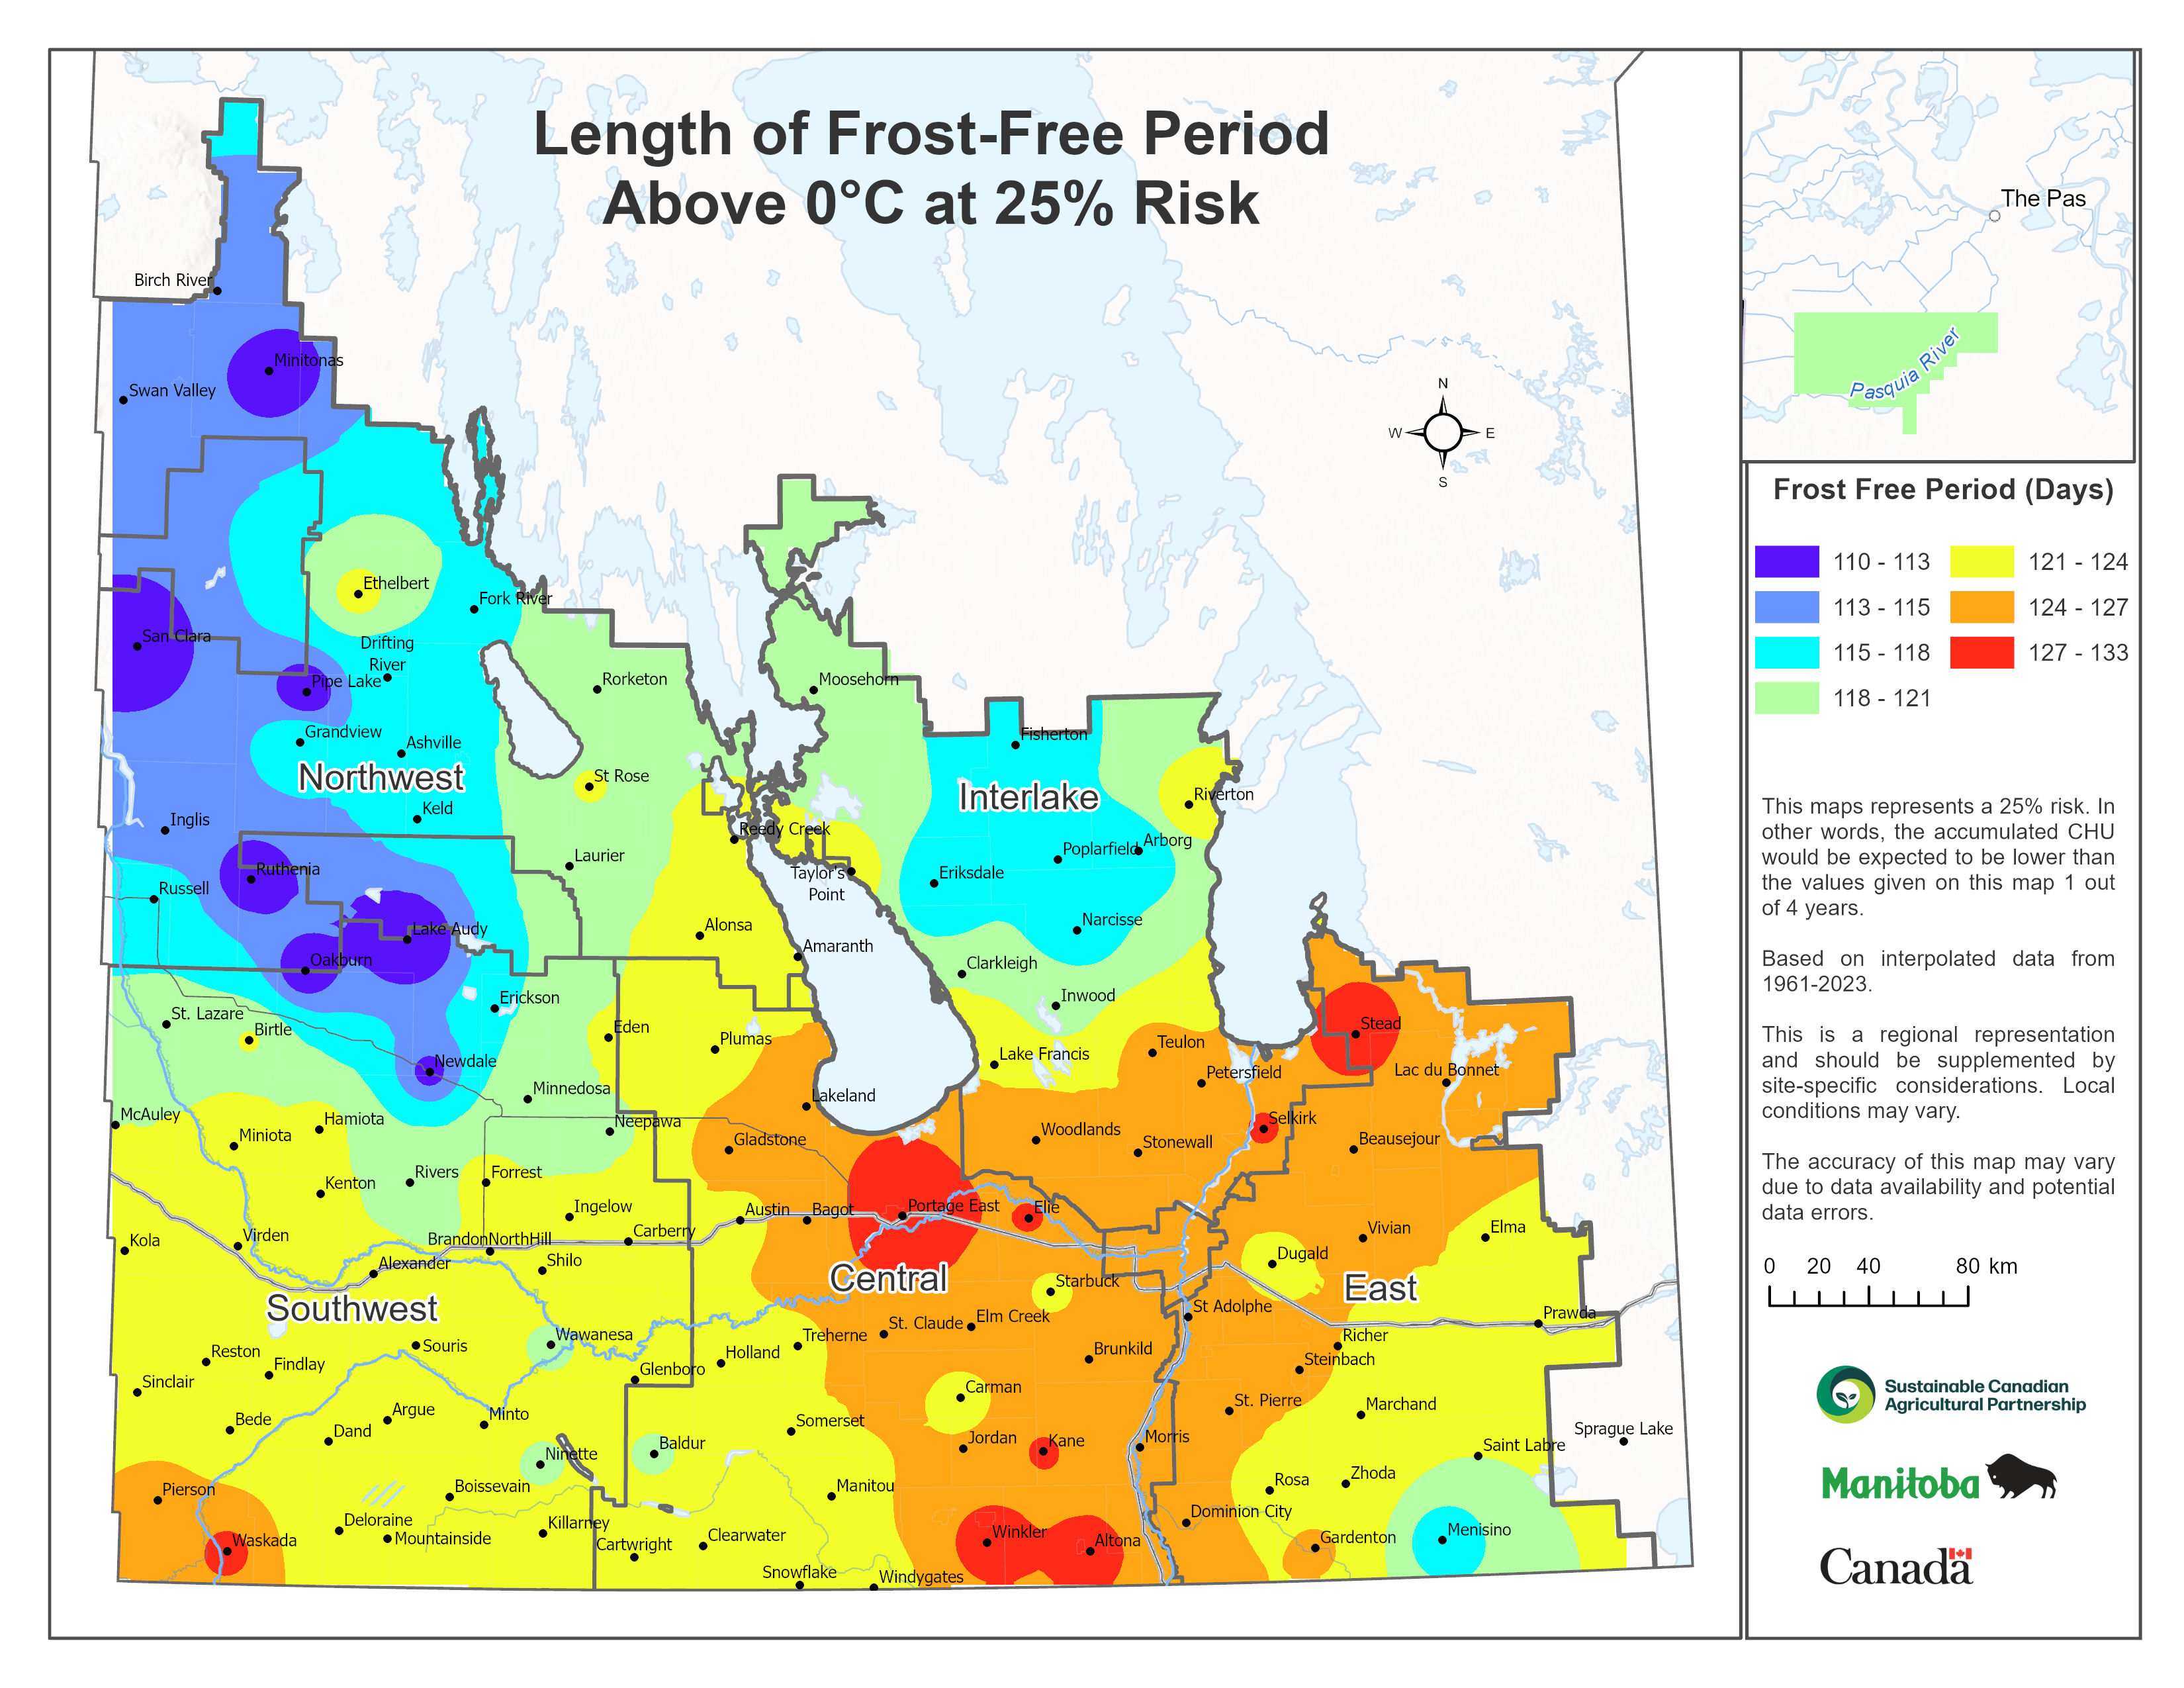
At the 25 percent risk level, or one-in-four-year occurrence (Figure 9), the most favourable localities centered on Portage la Prairie and Morden where the frost-free period ranges from 127 to 133 days. In these regions, many of the crops in Table 1 will have adequate time to mature.
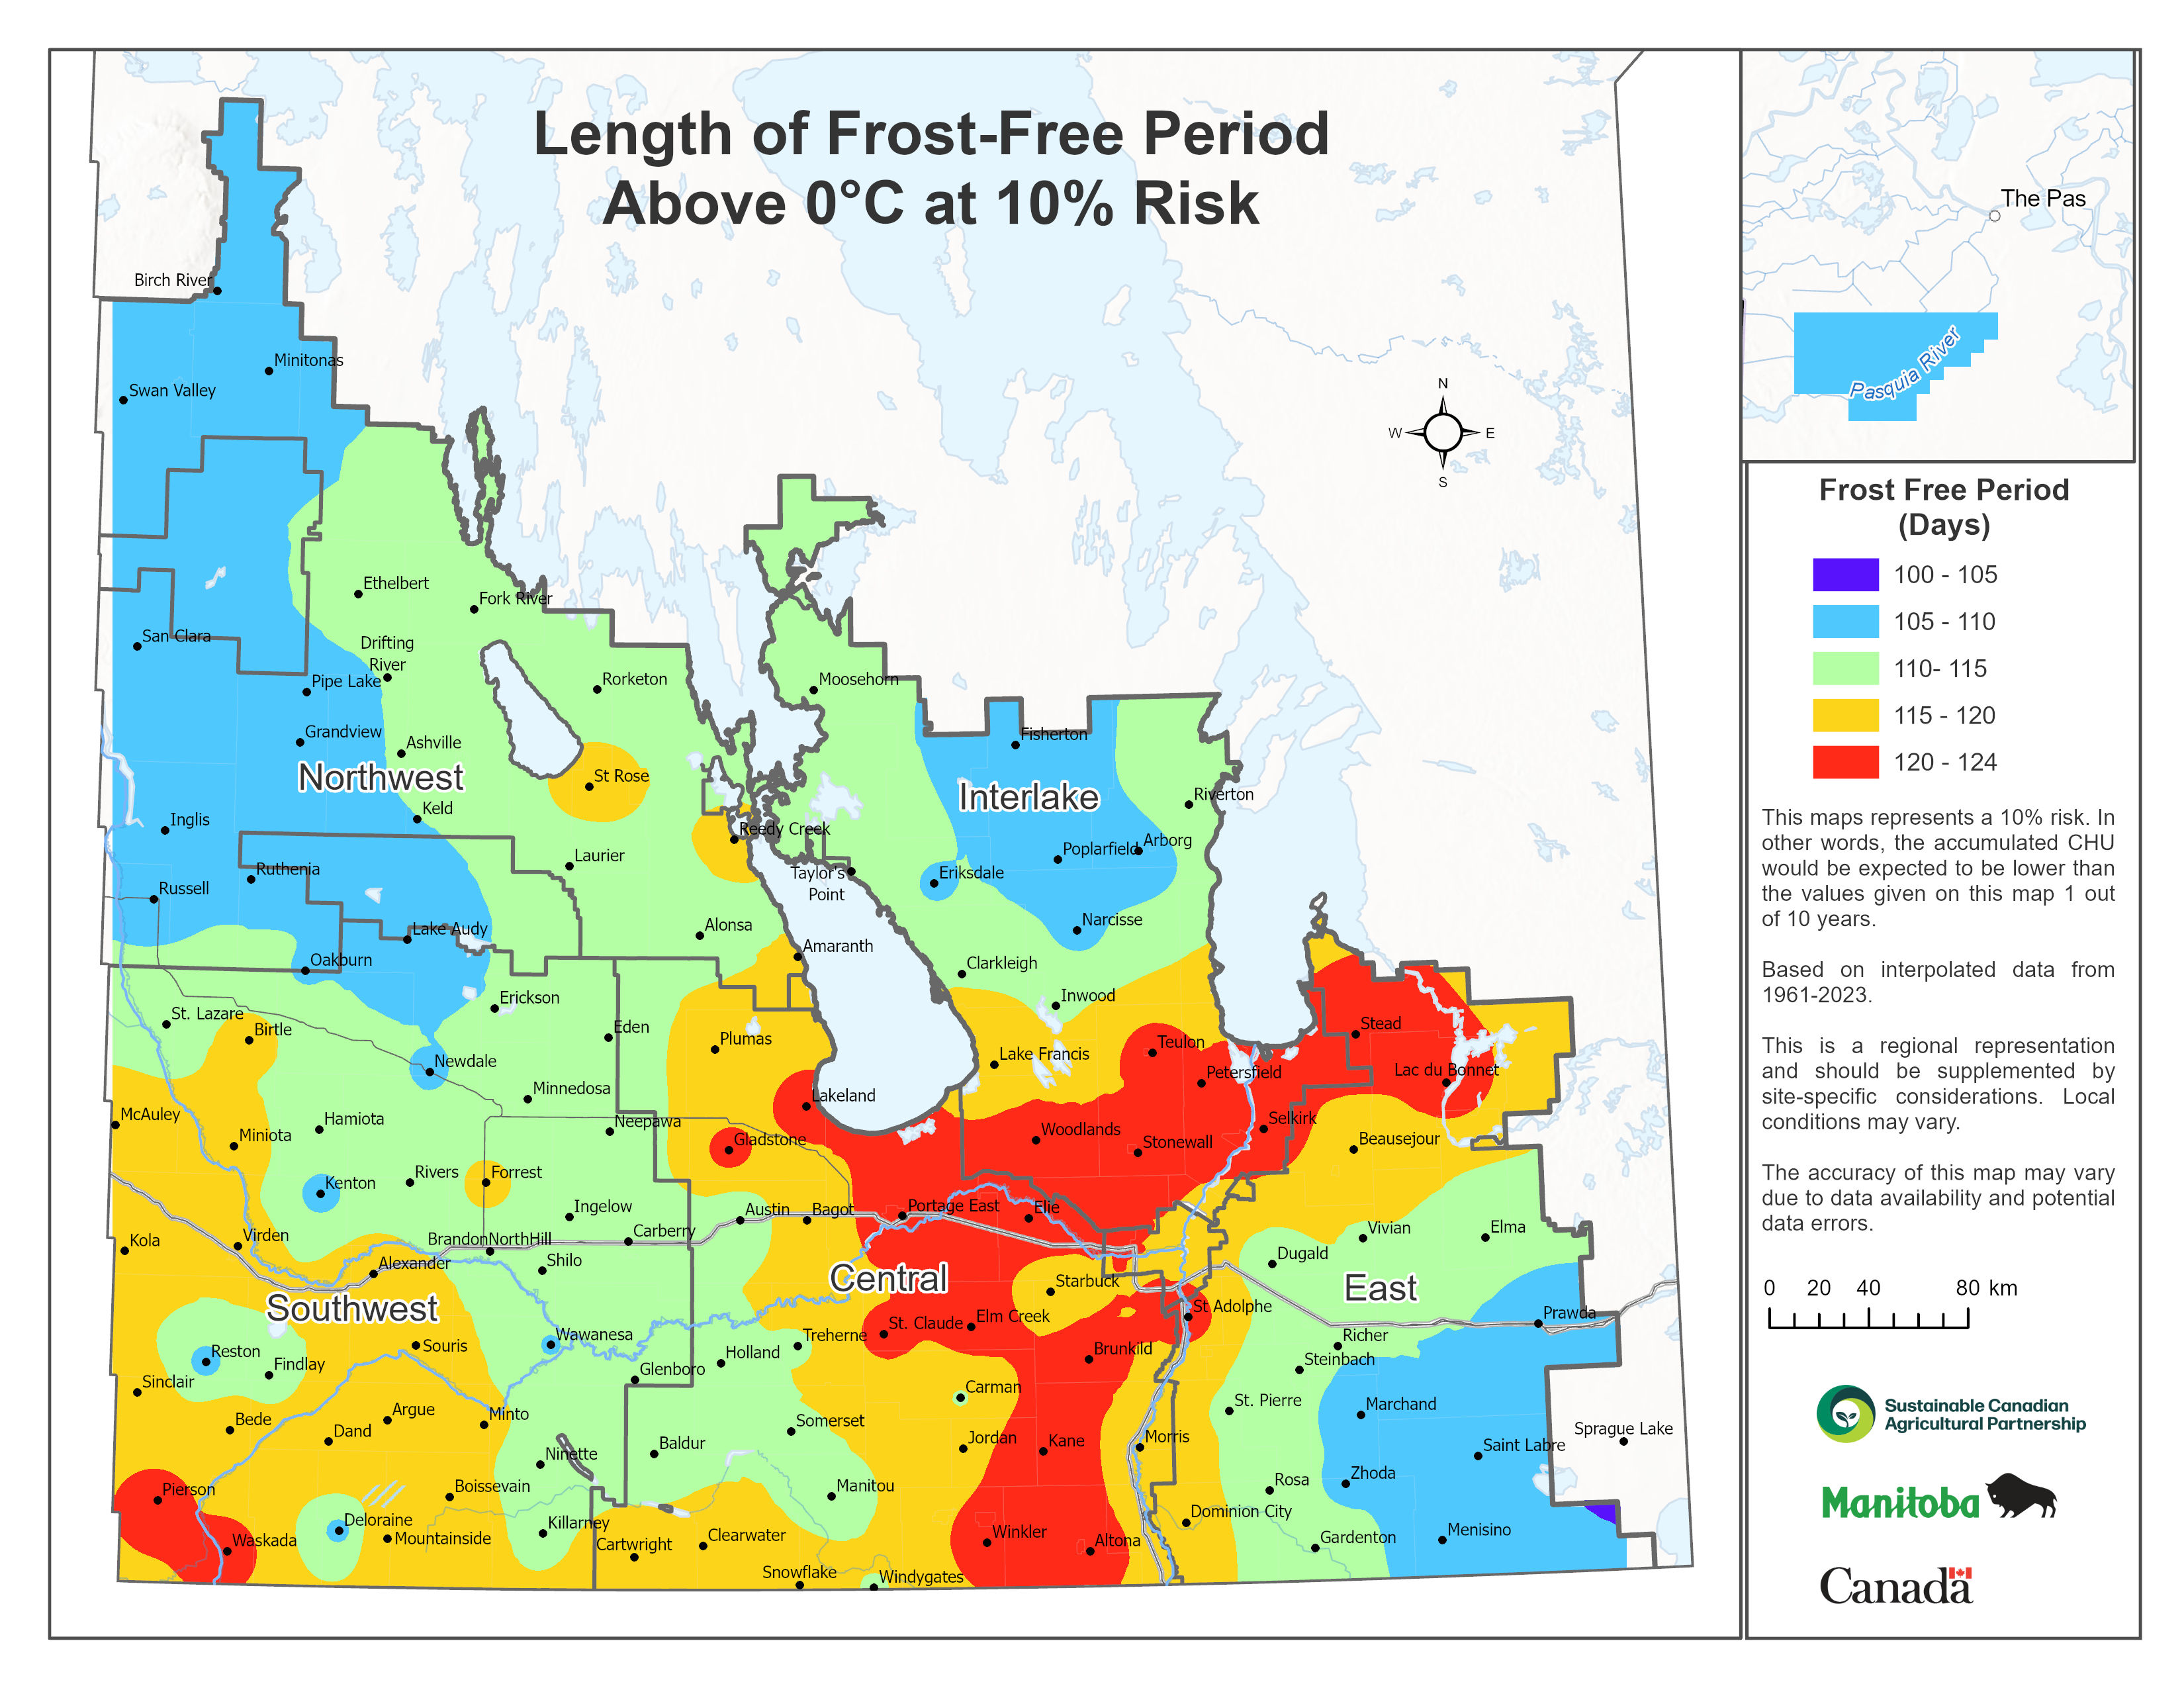
At a 10 percent risk level, or one year in 10, the frost-free period is shorter in all areas (Figure 10).
Heat Accumulations
Plants and insects require heat energy to grow and develop. It is not enough that temperatures remain above freezing. Each organism has a base temperature below which no growth or development will occur. Heat accumulated above a given base temperature is usually reported as "growing degree-days" (GDD).
Calculation of GDD is relatively straight forward: heat accumulated each day is determined by adding together the maximum and minimum temperatures and dividing the total by two to obtain a daily average. The base temperature specific to a given crop or insect is subtracted from this average (Table 2). This value represents the daily heat useful to a crop or insect. Results greater than zero are added to determine the weekly, monthly or yearly GDD accumulated.
GDD can be used to:
- assess the suitability of a region for the production of a particular crop;
- estimate the growth-stages of crops or life stages of insects;
- predict maturity and cutting dates of forage crops;
- estimate the heat stress on crops such as canola;
- help estimate the yields of cereals and canola, as well as the protein content of cereals and the oil content of canola; and
- as a planning tool for spacing planting dates to separate harvest dates in vegetable production.
| Crop or Insect | Base Temperature (° C) |
|---|---|
| Spinach | 2.2 |
| Lettuce | 4.4 |
| Wheat | 4.7 |
| General Plant Growth | 5.0 |
| Canola | 5.0 |
| Forages | 5.0 |
| Peas and Asparagus | 5.5 |
| Cabbage Maggot | 6.0 |
| Potatoes | 7.0 |
| Variegated Cutworm | 7.0 |
| Corn and Beans | 10.0 |
| Grasshoppers, Corn Borers |
10.0 |
| Pumpkins and Tomatoes | 13.0 |
| General Insect Development, House flies |
15.0 |
GDD above 5°C
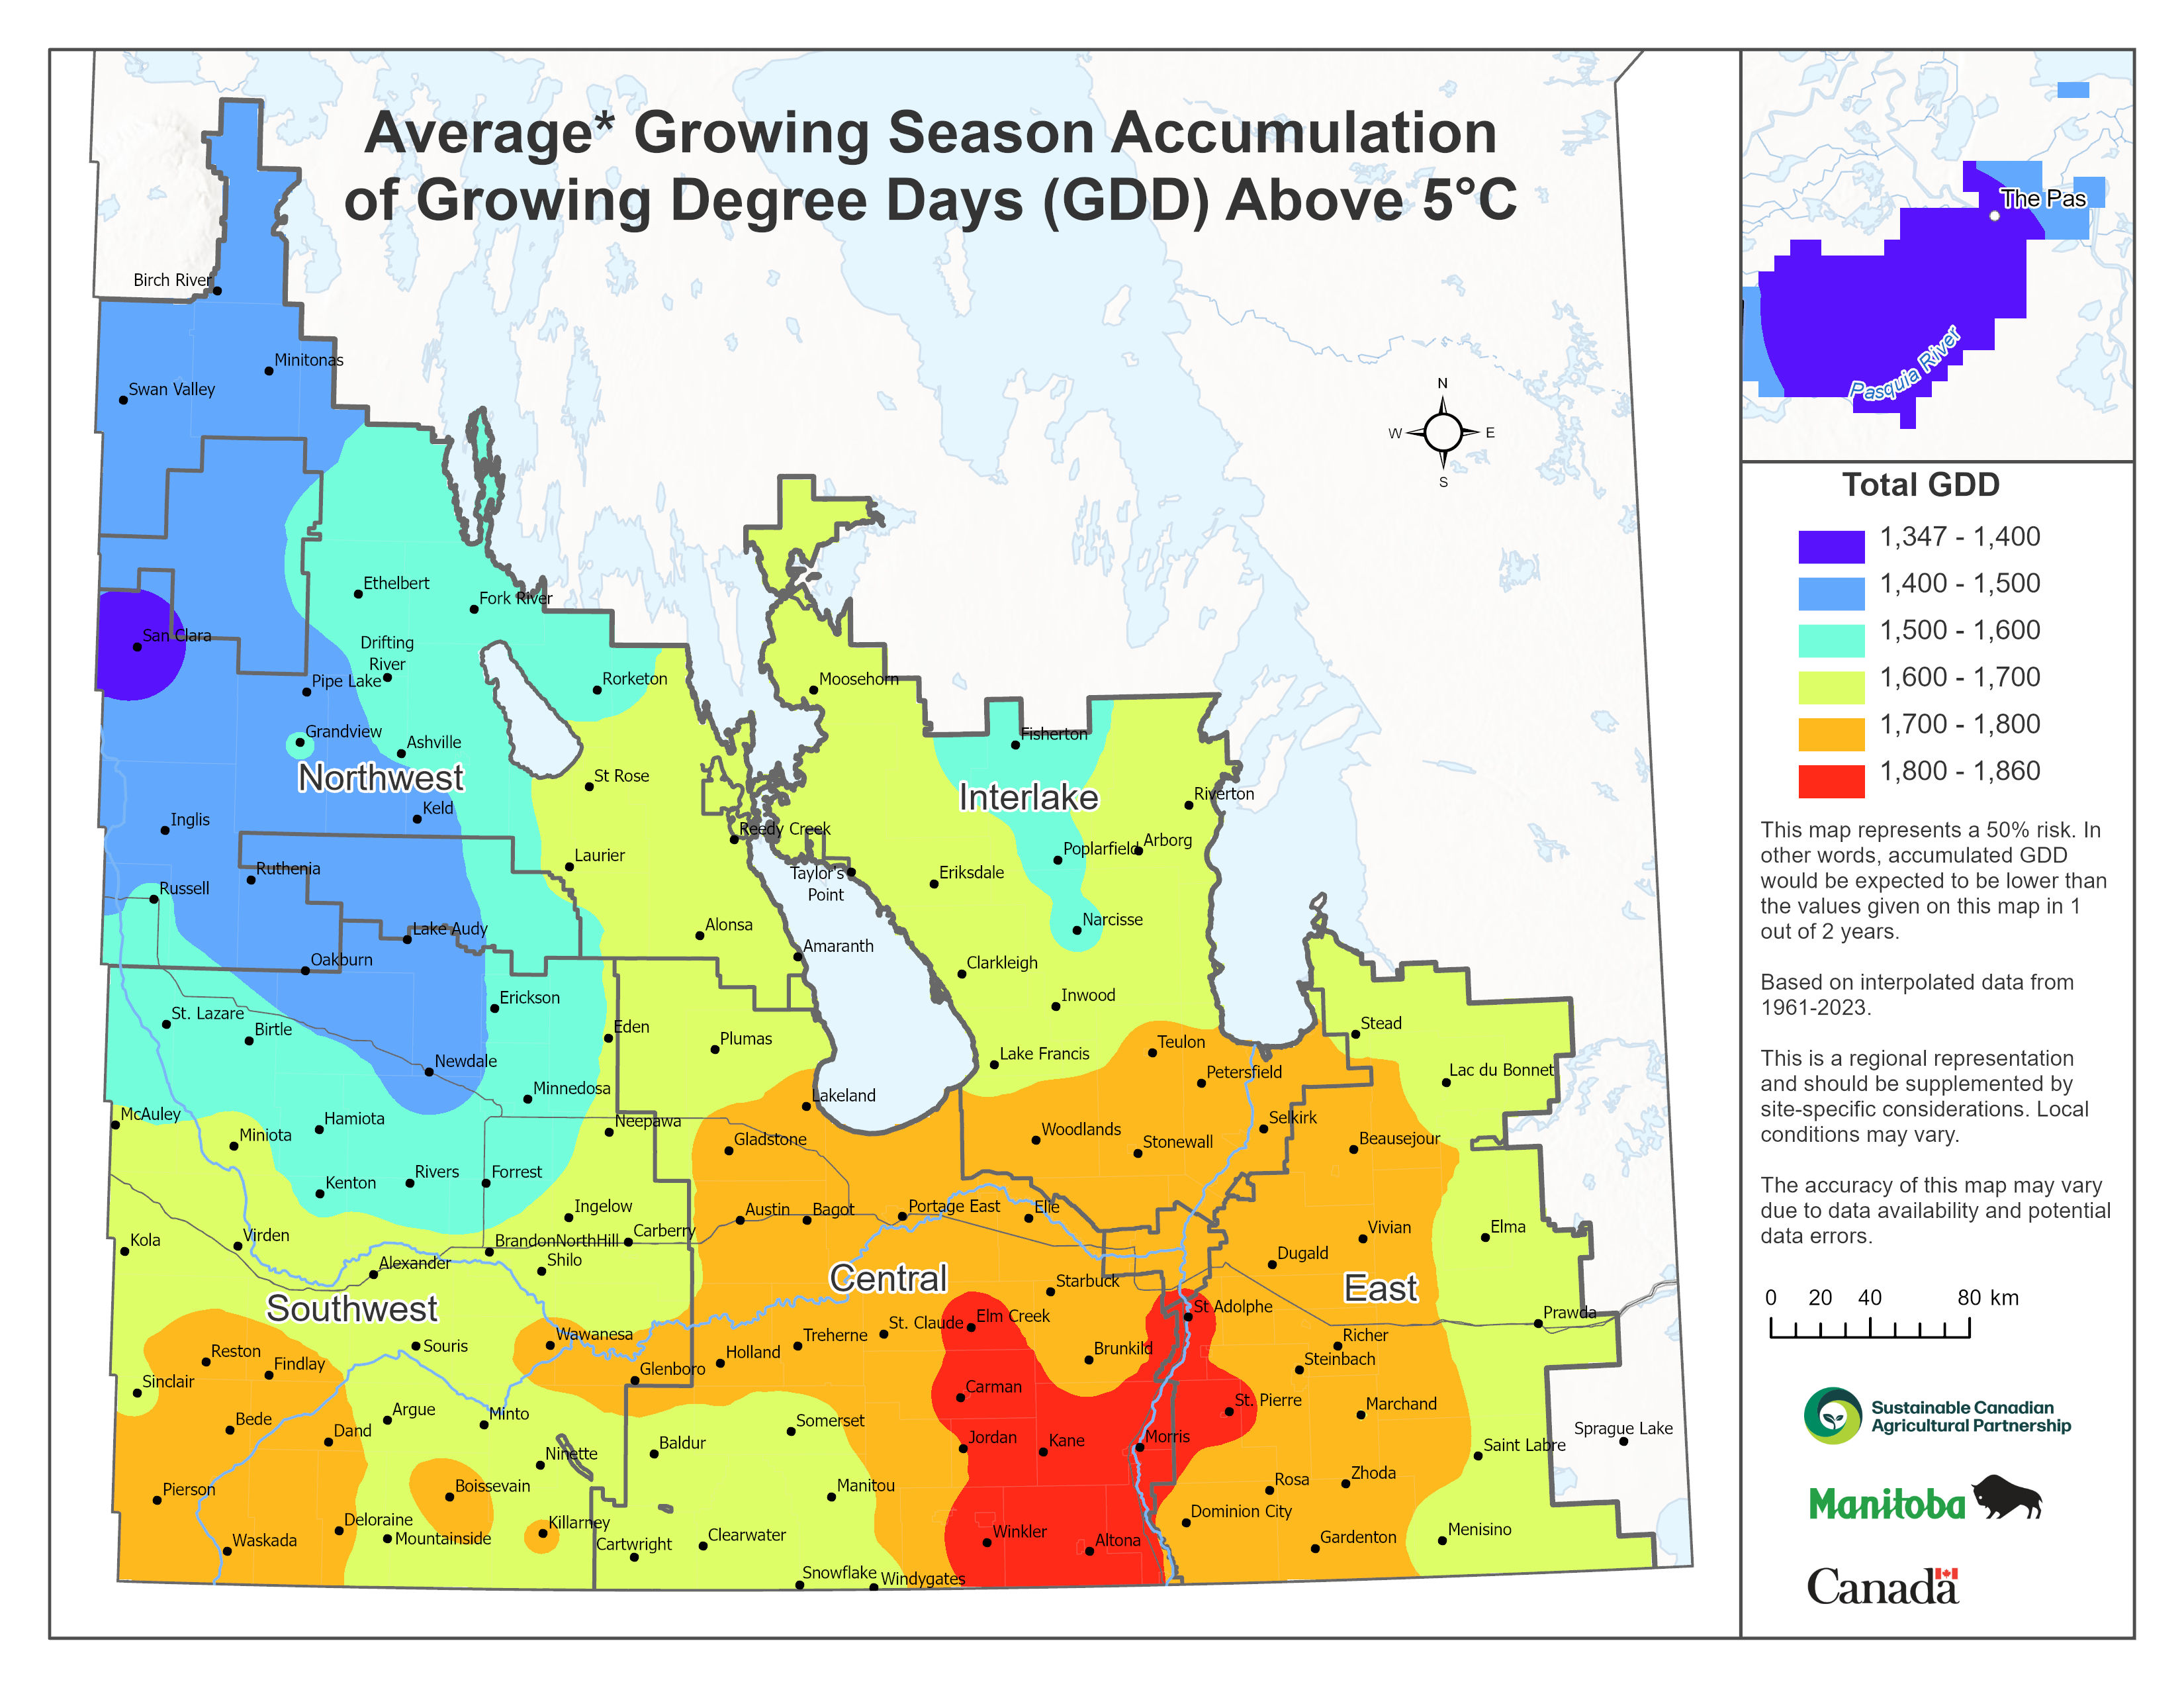
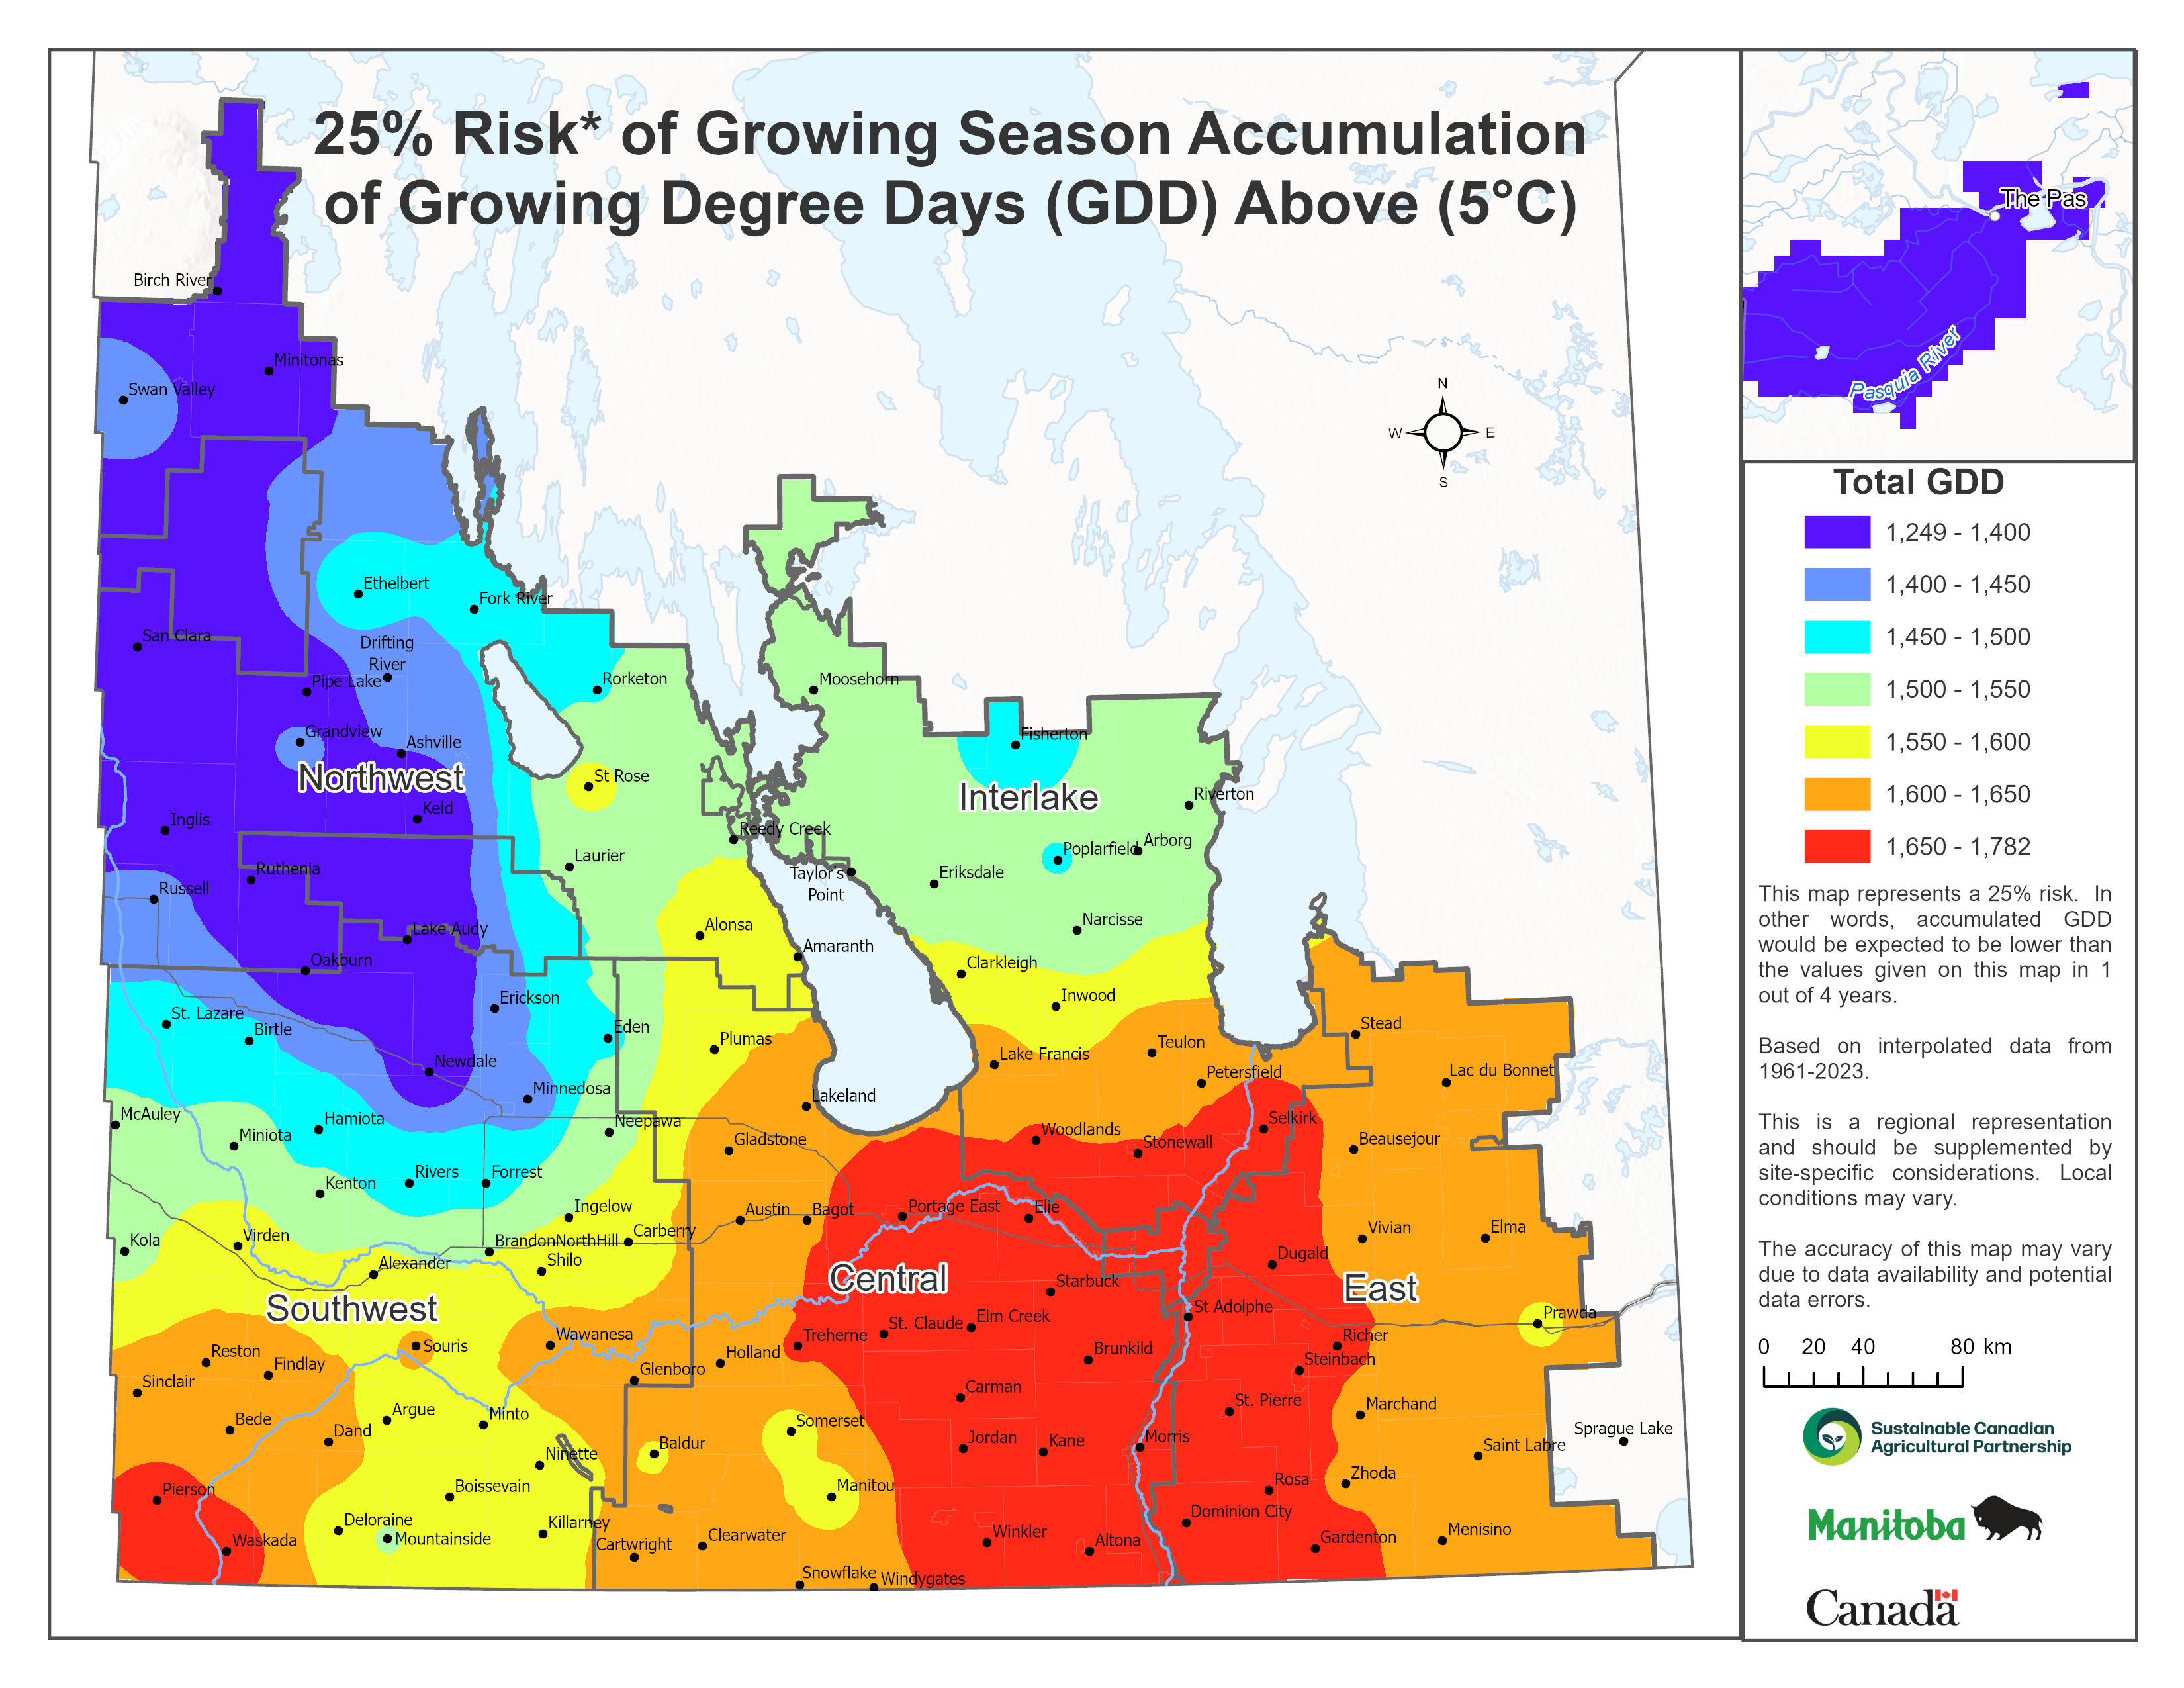
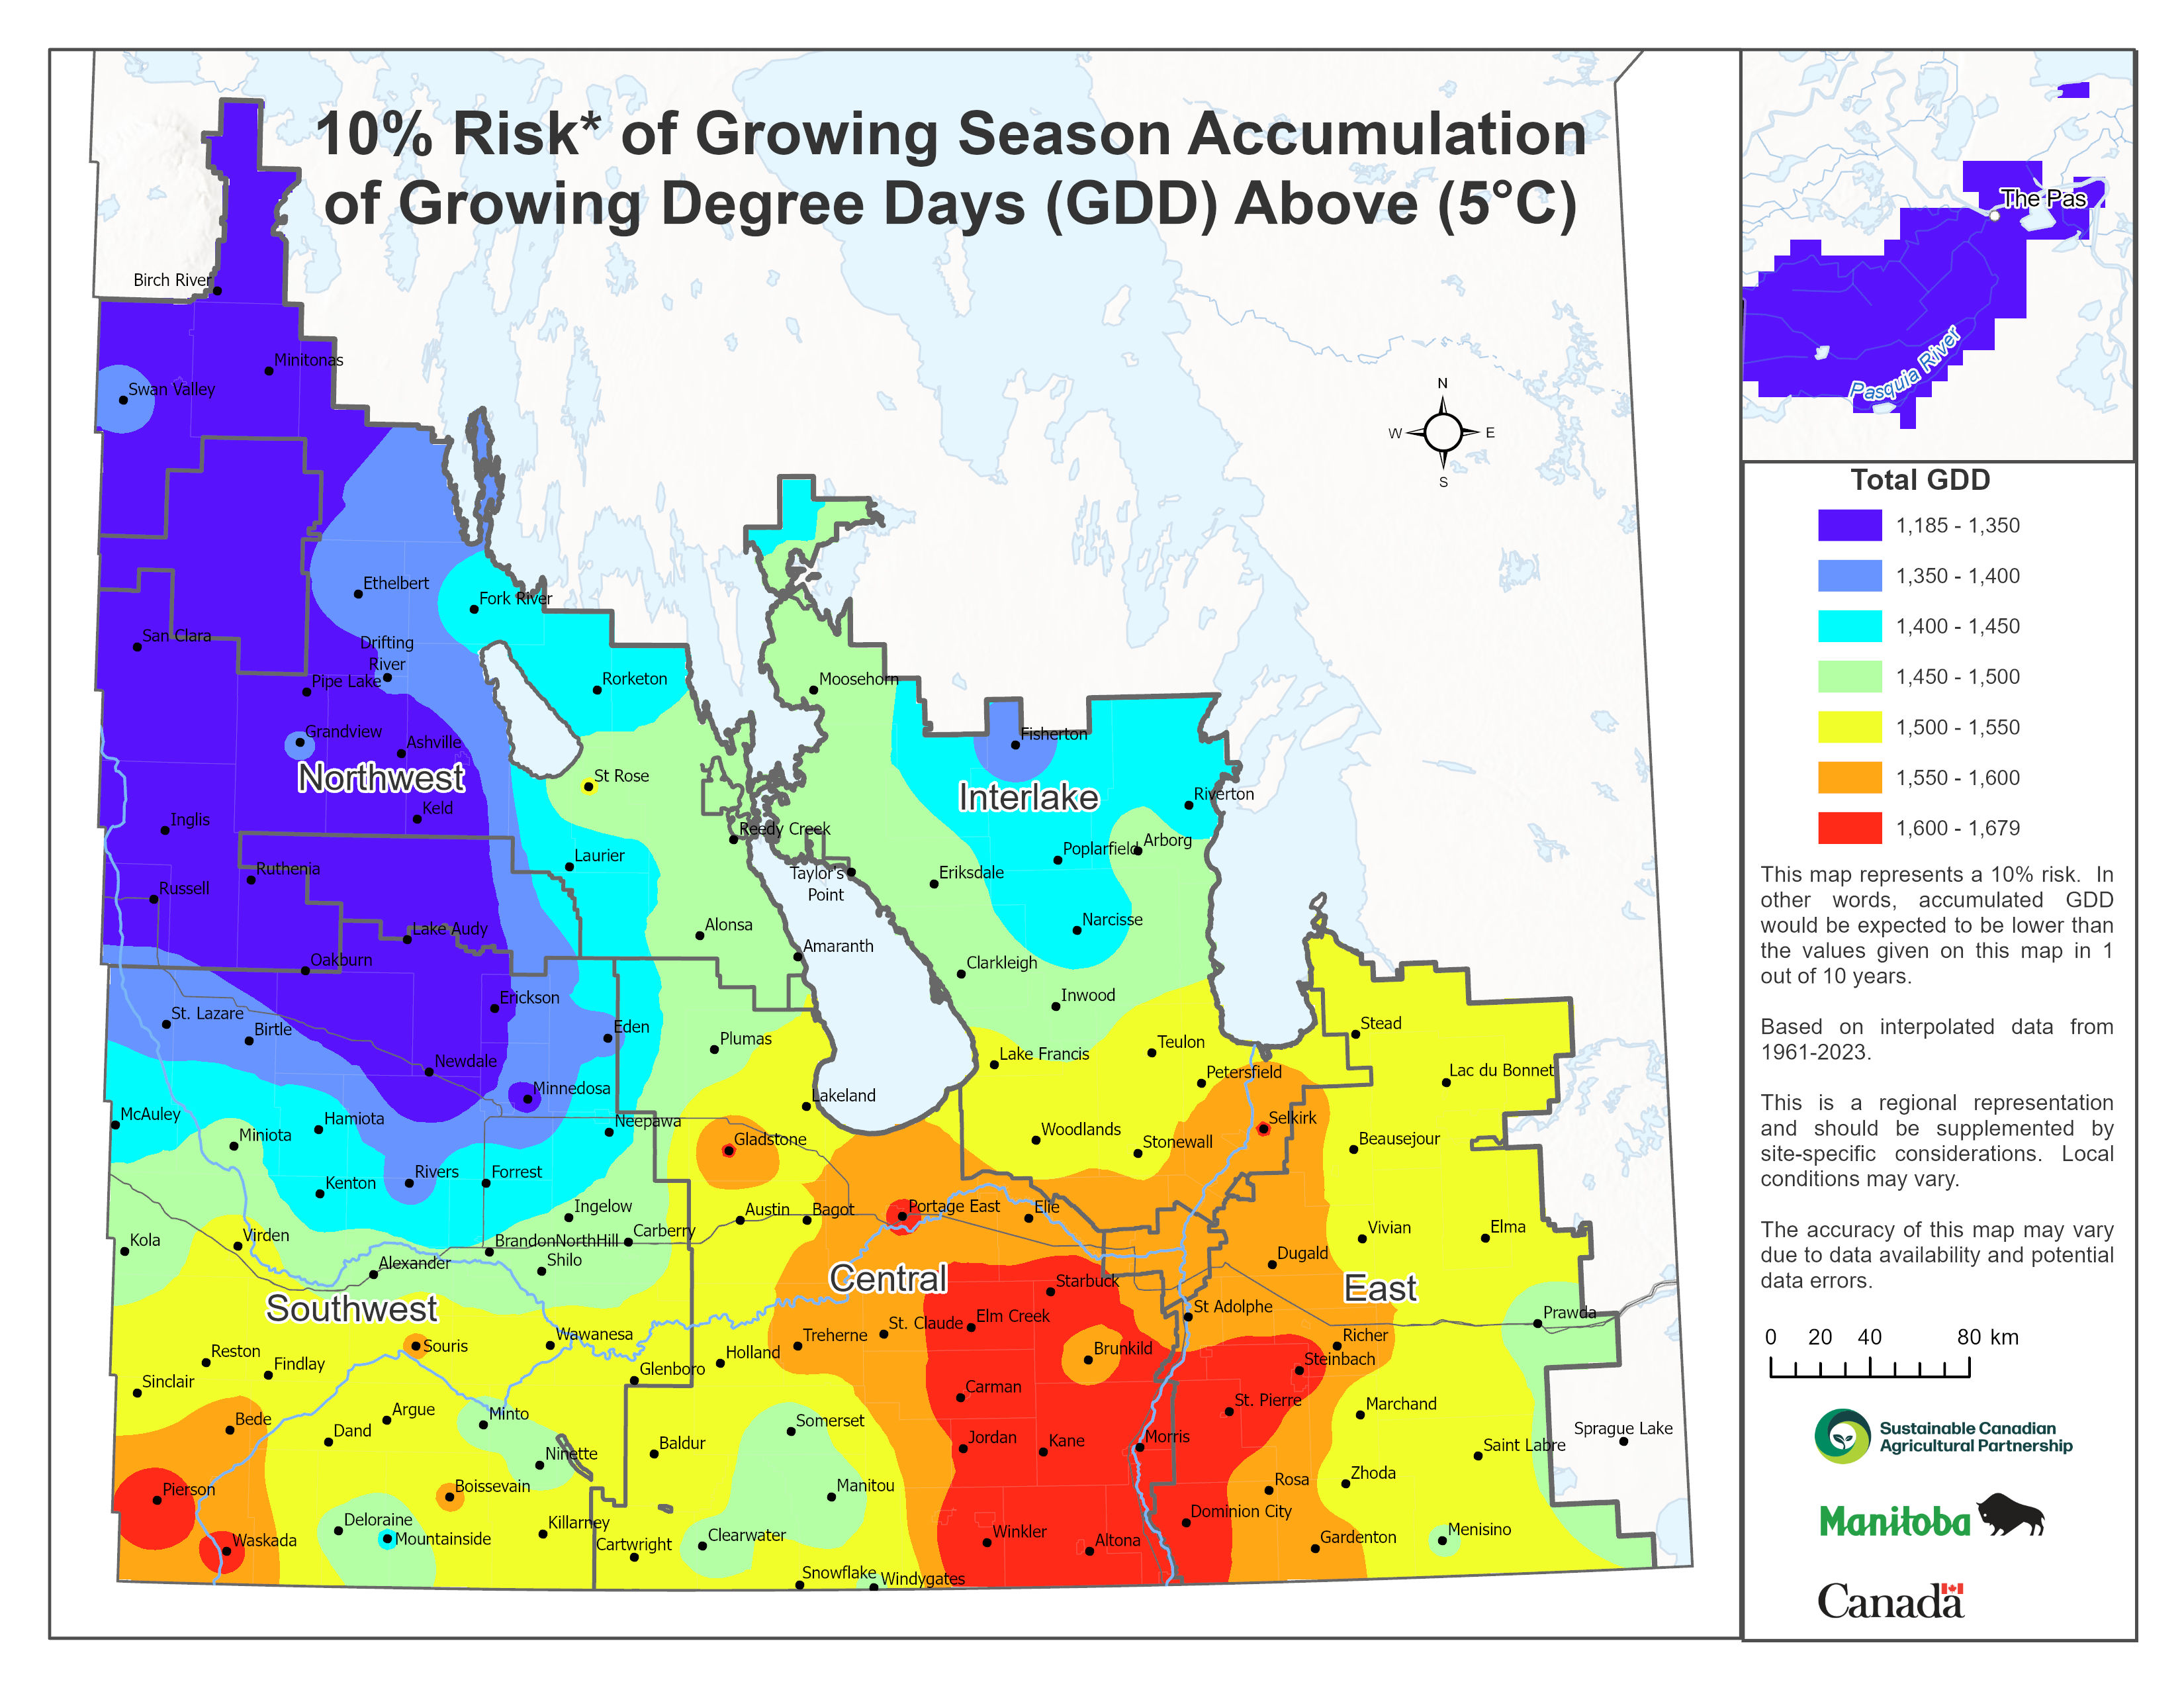
Cereal grains such as spring wheat, barley, oats and buckwheat, as well as oilseeds such as canola, require a minimum accumulation of about 1,200 GDD above 5°C to reach maturity. The map of average GDD above 5°C (Figure 11) illustrates that all regions within Manitoba are suited to cereal and oilseed production based on useful heat accumulation. The Northwest region has the fewest average accumulated GDD above 5°C at 1,347 to 1,500. The highest average GDD accumulations are in the south central region with average annual totals between 1,800 and 1,860. Maps of the 25 percent (Figure 12) risk levels for this parameter show that cereals and oilseeds will mature over most of the time in the majority of regions. At the 10 percent risk level (Figure 13), the Northwest and northern Interlake region would accumulate less than 1,185 to 1,400 GDD one in 10 years.
GDD above 10°C
The average accumulation of GDD above 10°C is about 1,000 in the southern-most part of Manitoba and decreases north-westward (Figure 14). As in previous maps, the coldest locations are near Riding Mountain. At the 25 percent risk level or one-in-four-year occurrence (Figure 15), the geographic pattern is similar; however the values are approximately 50 GDD lower than average. The 10 percent risk map (Figure 16) generally shows a further reduction of 50 GDD in all areas.
GDD above 15°C
For the average accumulation of GDD above 15°C (Figure 17), the number of accumulated heat units decreases north-westward. Overall, the Morden to Emerson area experiences the highest average accumulation at 550 to 600 GDD above 15°C , while regions around Riding Mountain accumulate between 300 to 350 GDD above 15°C. At the one-in-four-year risk (Figure 18), the highest accumulated values are 500 to 550 GDD above base 15°C and the lowest values are between 250 to 300. The 10 percent risk map (Figure 19) shows a further reduction of 50 GDD in all regions.
Corn Heat Units
Corn is an important crop in Manitoba. As a result, the heat requirements for this crop have been studied in some detail. In central Canada, where the majority of corn is grown, studies have led to the development of the "corn heat unit."
The basic concept of the corn heat unit calculation is similar to the degree-day system; that is, the rate of growth is assumed to increase with increasing temperatures. However, day and night temperatures are treated separately. It is assumed that no growth occurs with night temperatures below 4.4°C or day temperatures below 10°C . In addition, maximum growth occurs at 30°C and decreases with higher temperatures, accounting for the detrimental effects of very high temperatures.
Corn heat units (CHU) for each day are calculated by the formula:
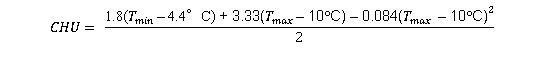
Where: Tmax = Daily maximum temperature (°C)
Most corn hybrids have been specifically rated for southern Manitoba. A listing of these hybrids can be found in publications such as the Field and Crop Recommendations for Manitoba. Corn hybrids grown for silage require 2,000 to 2,100 CHU annually, while the earliest grain corn hybrids require 2,200 to 2,400 CHU to reach physiological maturity.
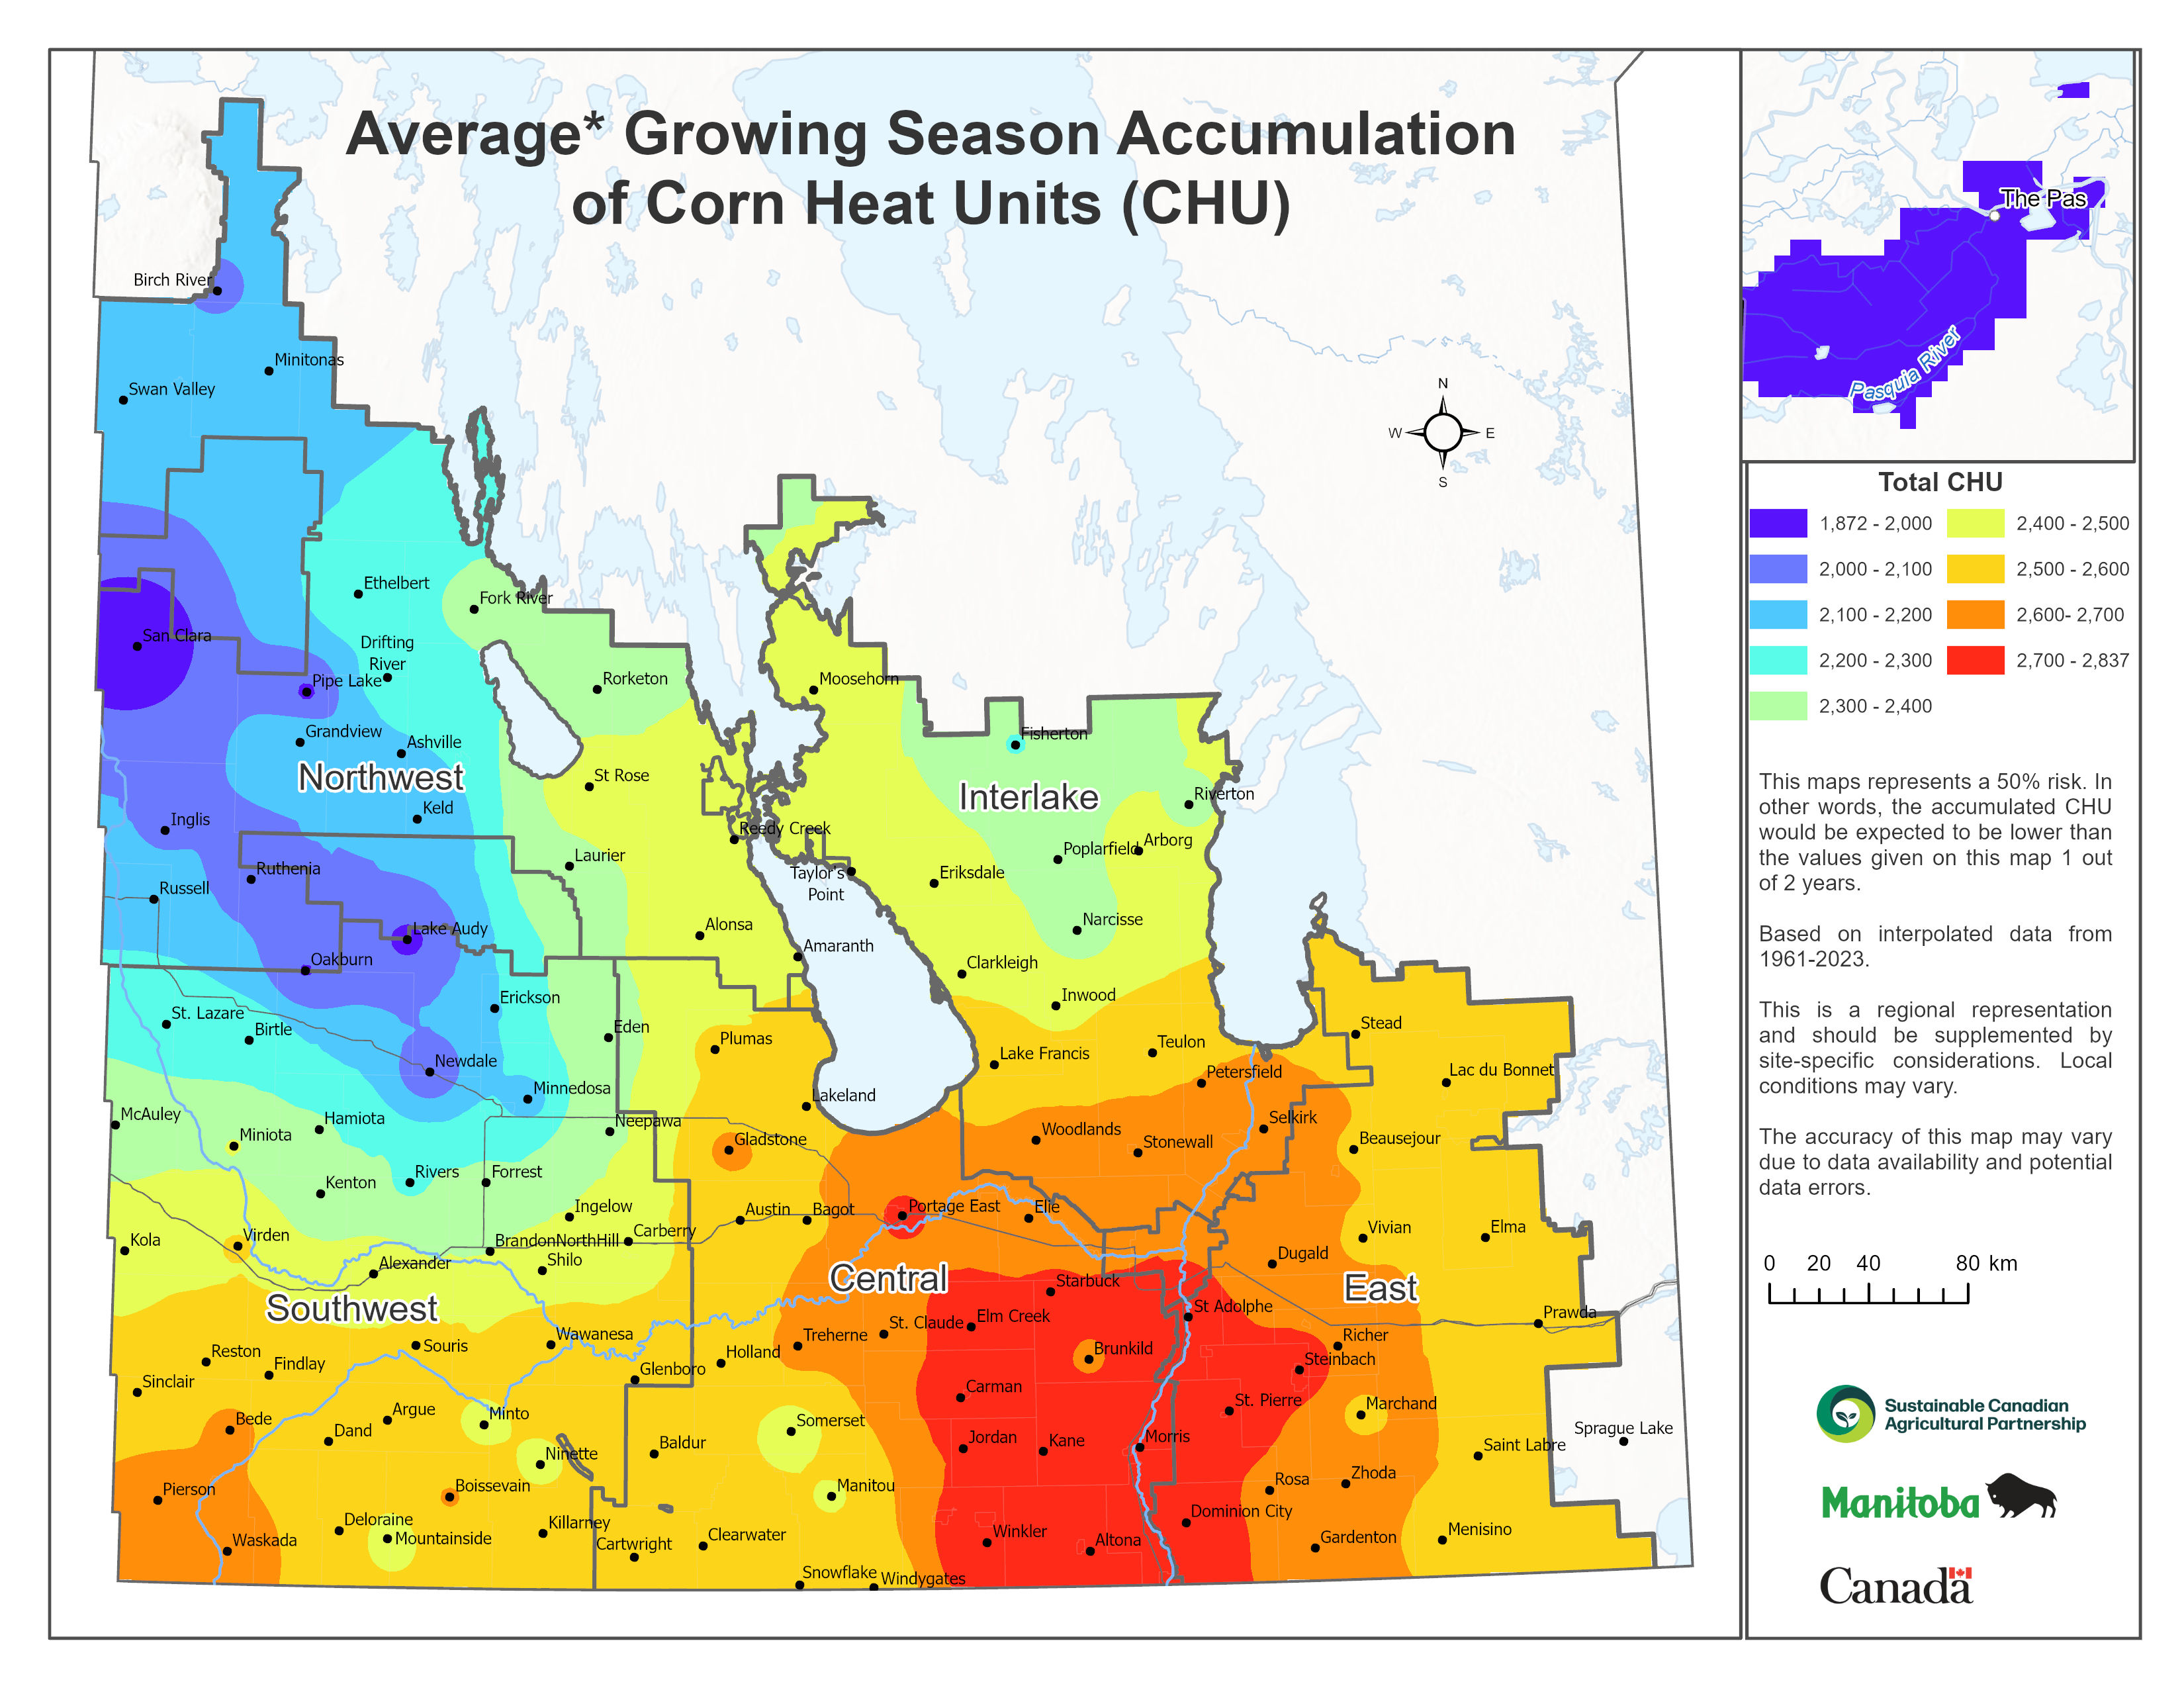
CHU were accumulated over the growing season (May 15 to the date of occurrence of the first fall frost of -2.2°). The map of the average CHU accumulation (Figure 20) shows that the best area for corn production is south of Lake Manitoba and Lake Winnipeg, between the Manitoba escarpment and west of a line from Steinbach to Pinawa. Within this area, the Central region along the Red River Valley all receive 2,700 to 2,800 CHU on average. In an average year, the Northwest region has viable locations for successful grain corn production with most of the area accumulating an average of 2,400 CHU.
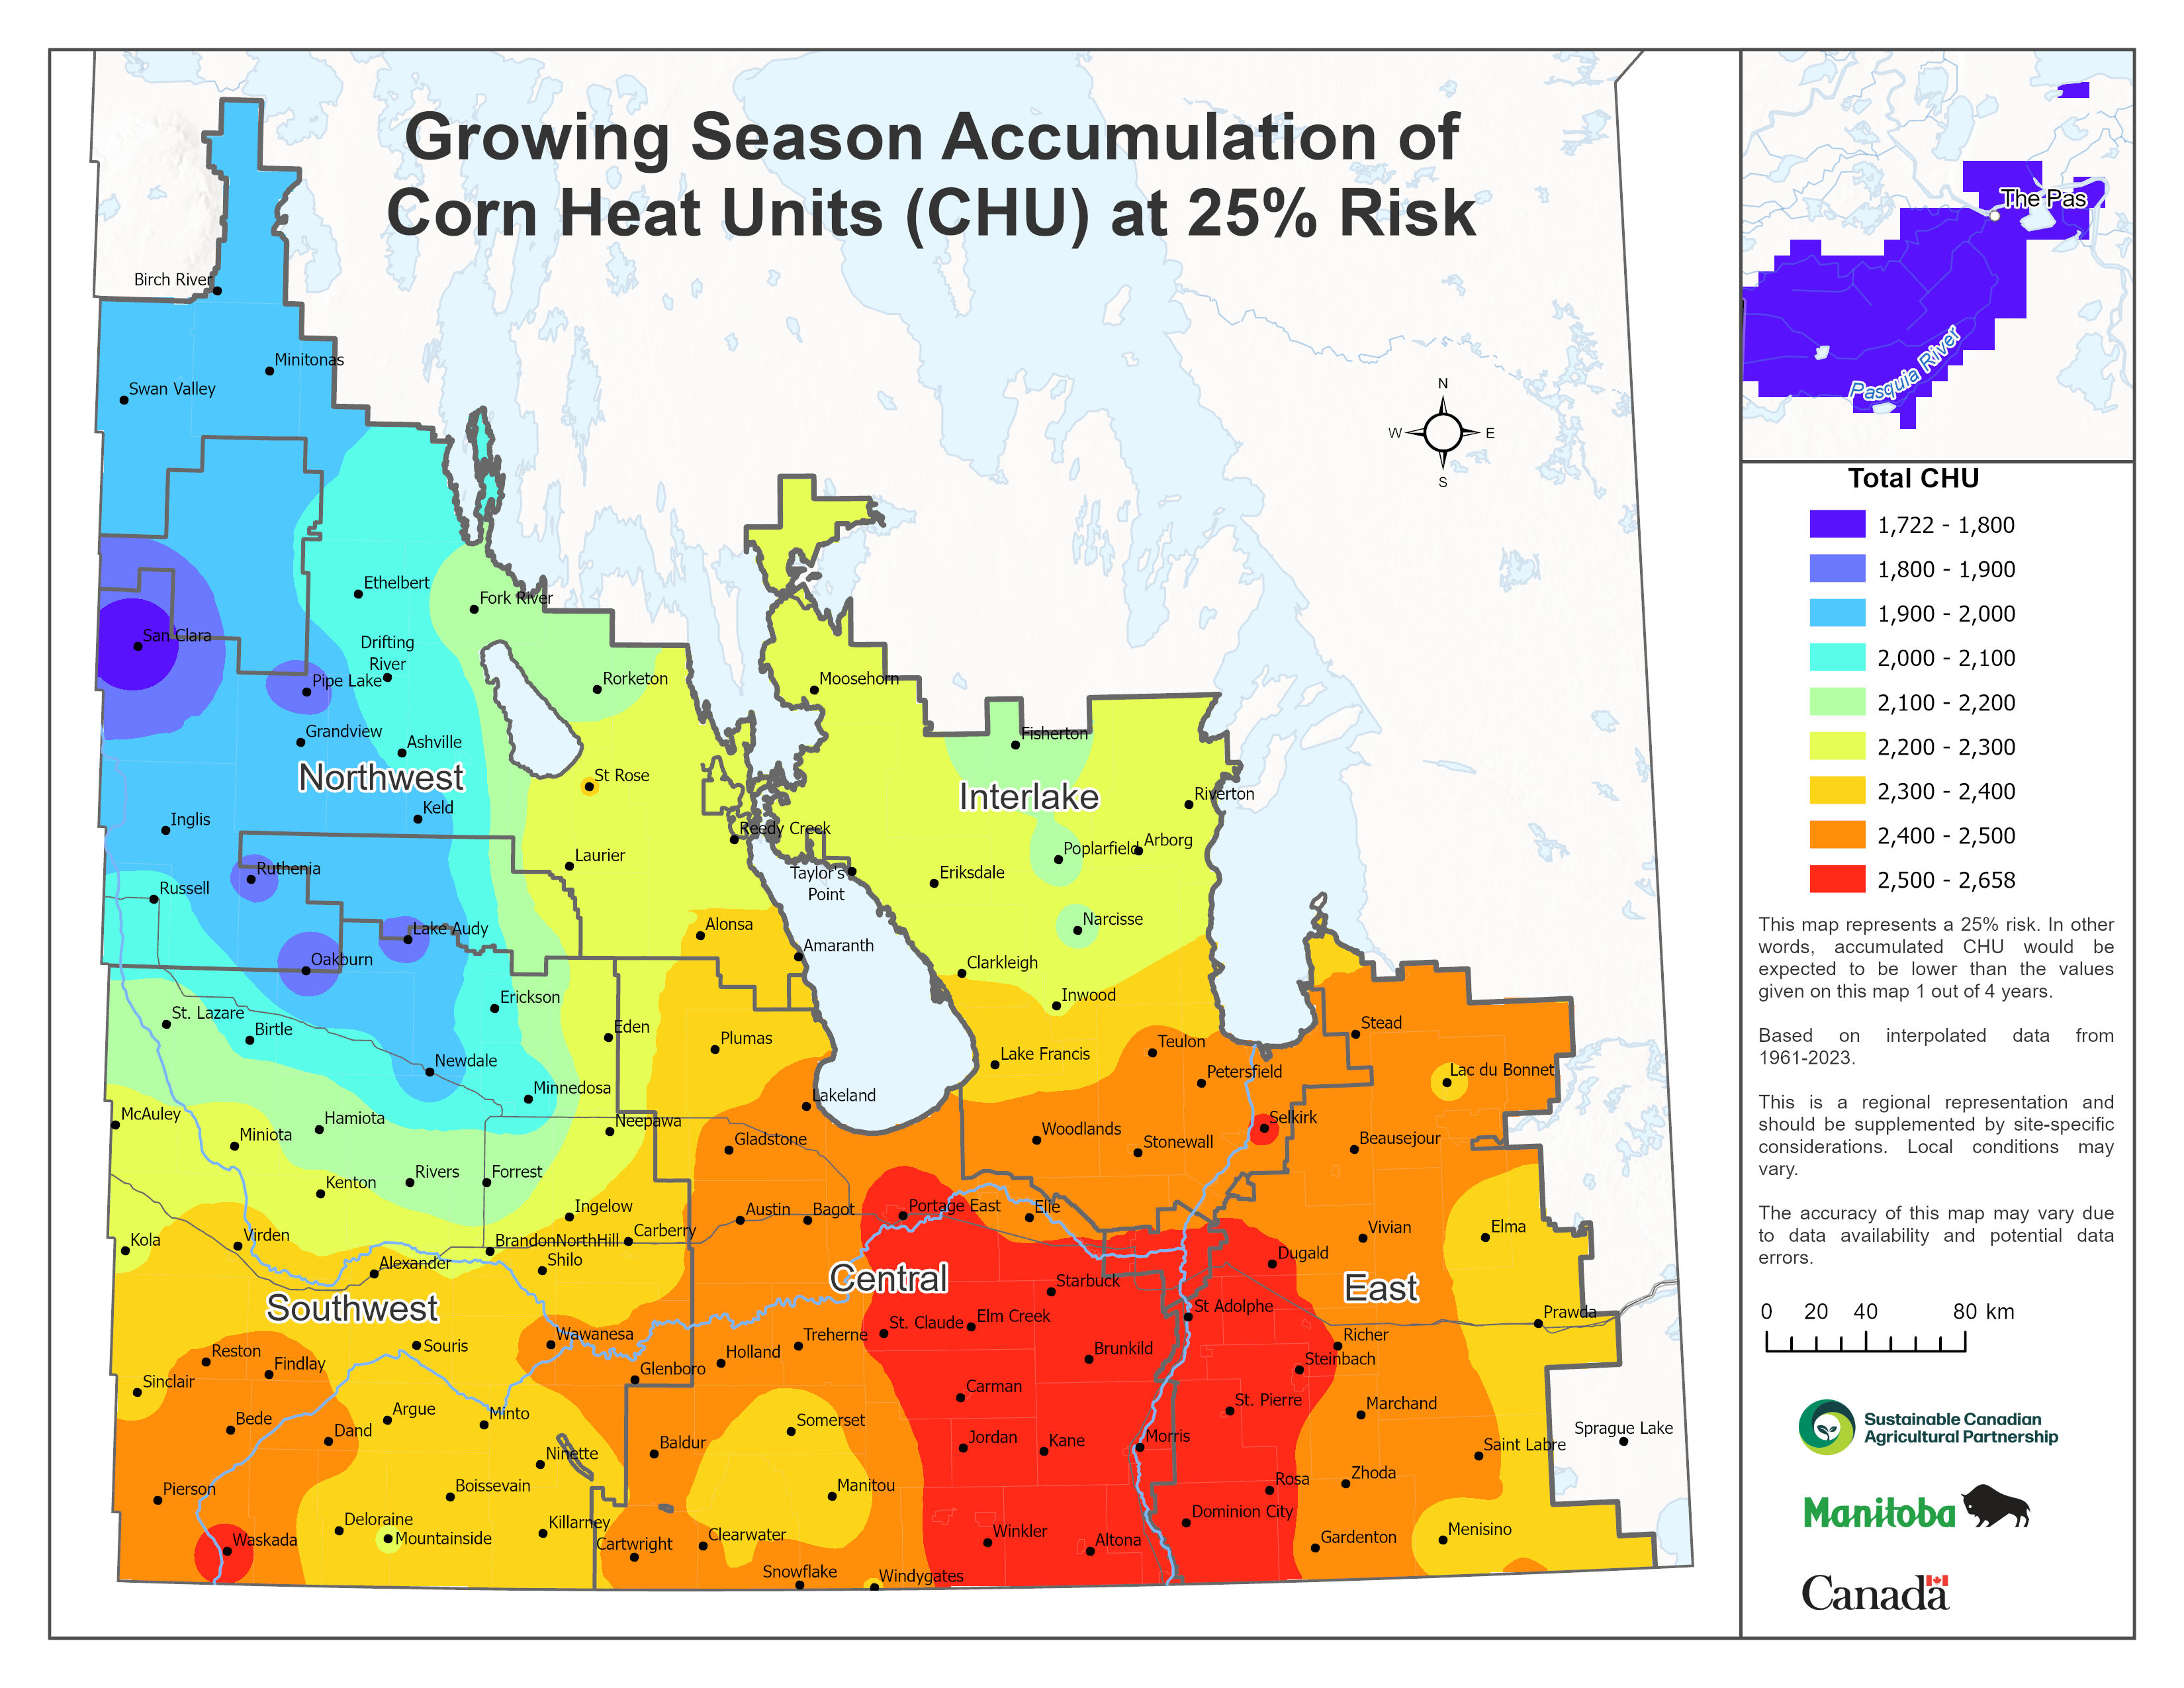
At a 25 percent risk level, or one-in-four-year occurrence (Figure 21), a hybrid with a 2,400 CHU rating will mature in only in the Central and parts of the Eastern region. In other areas, a 2,400 CHU hybrid will not mature in one year out of four.
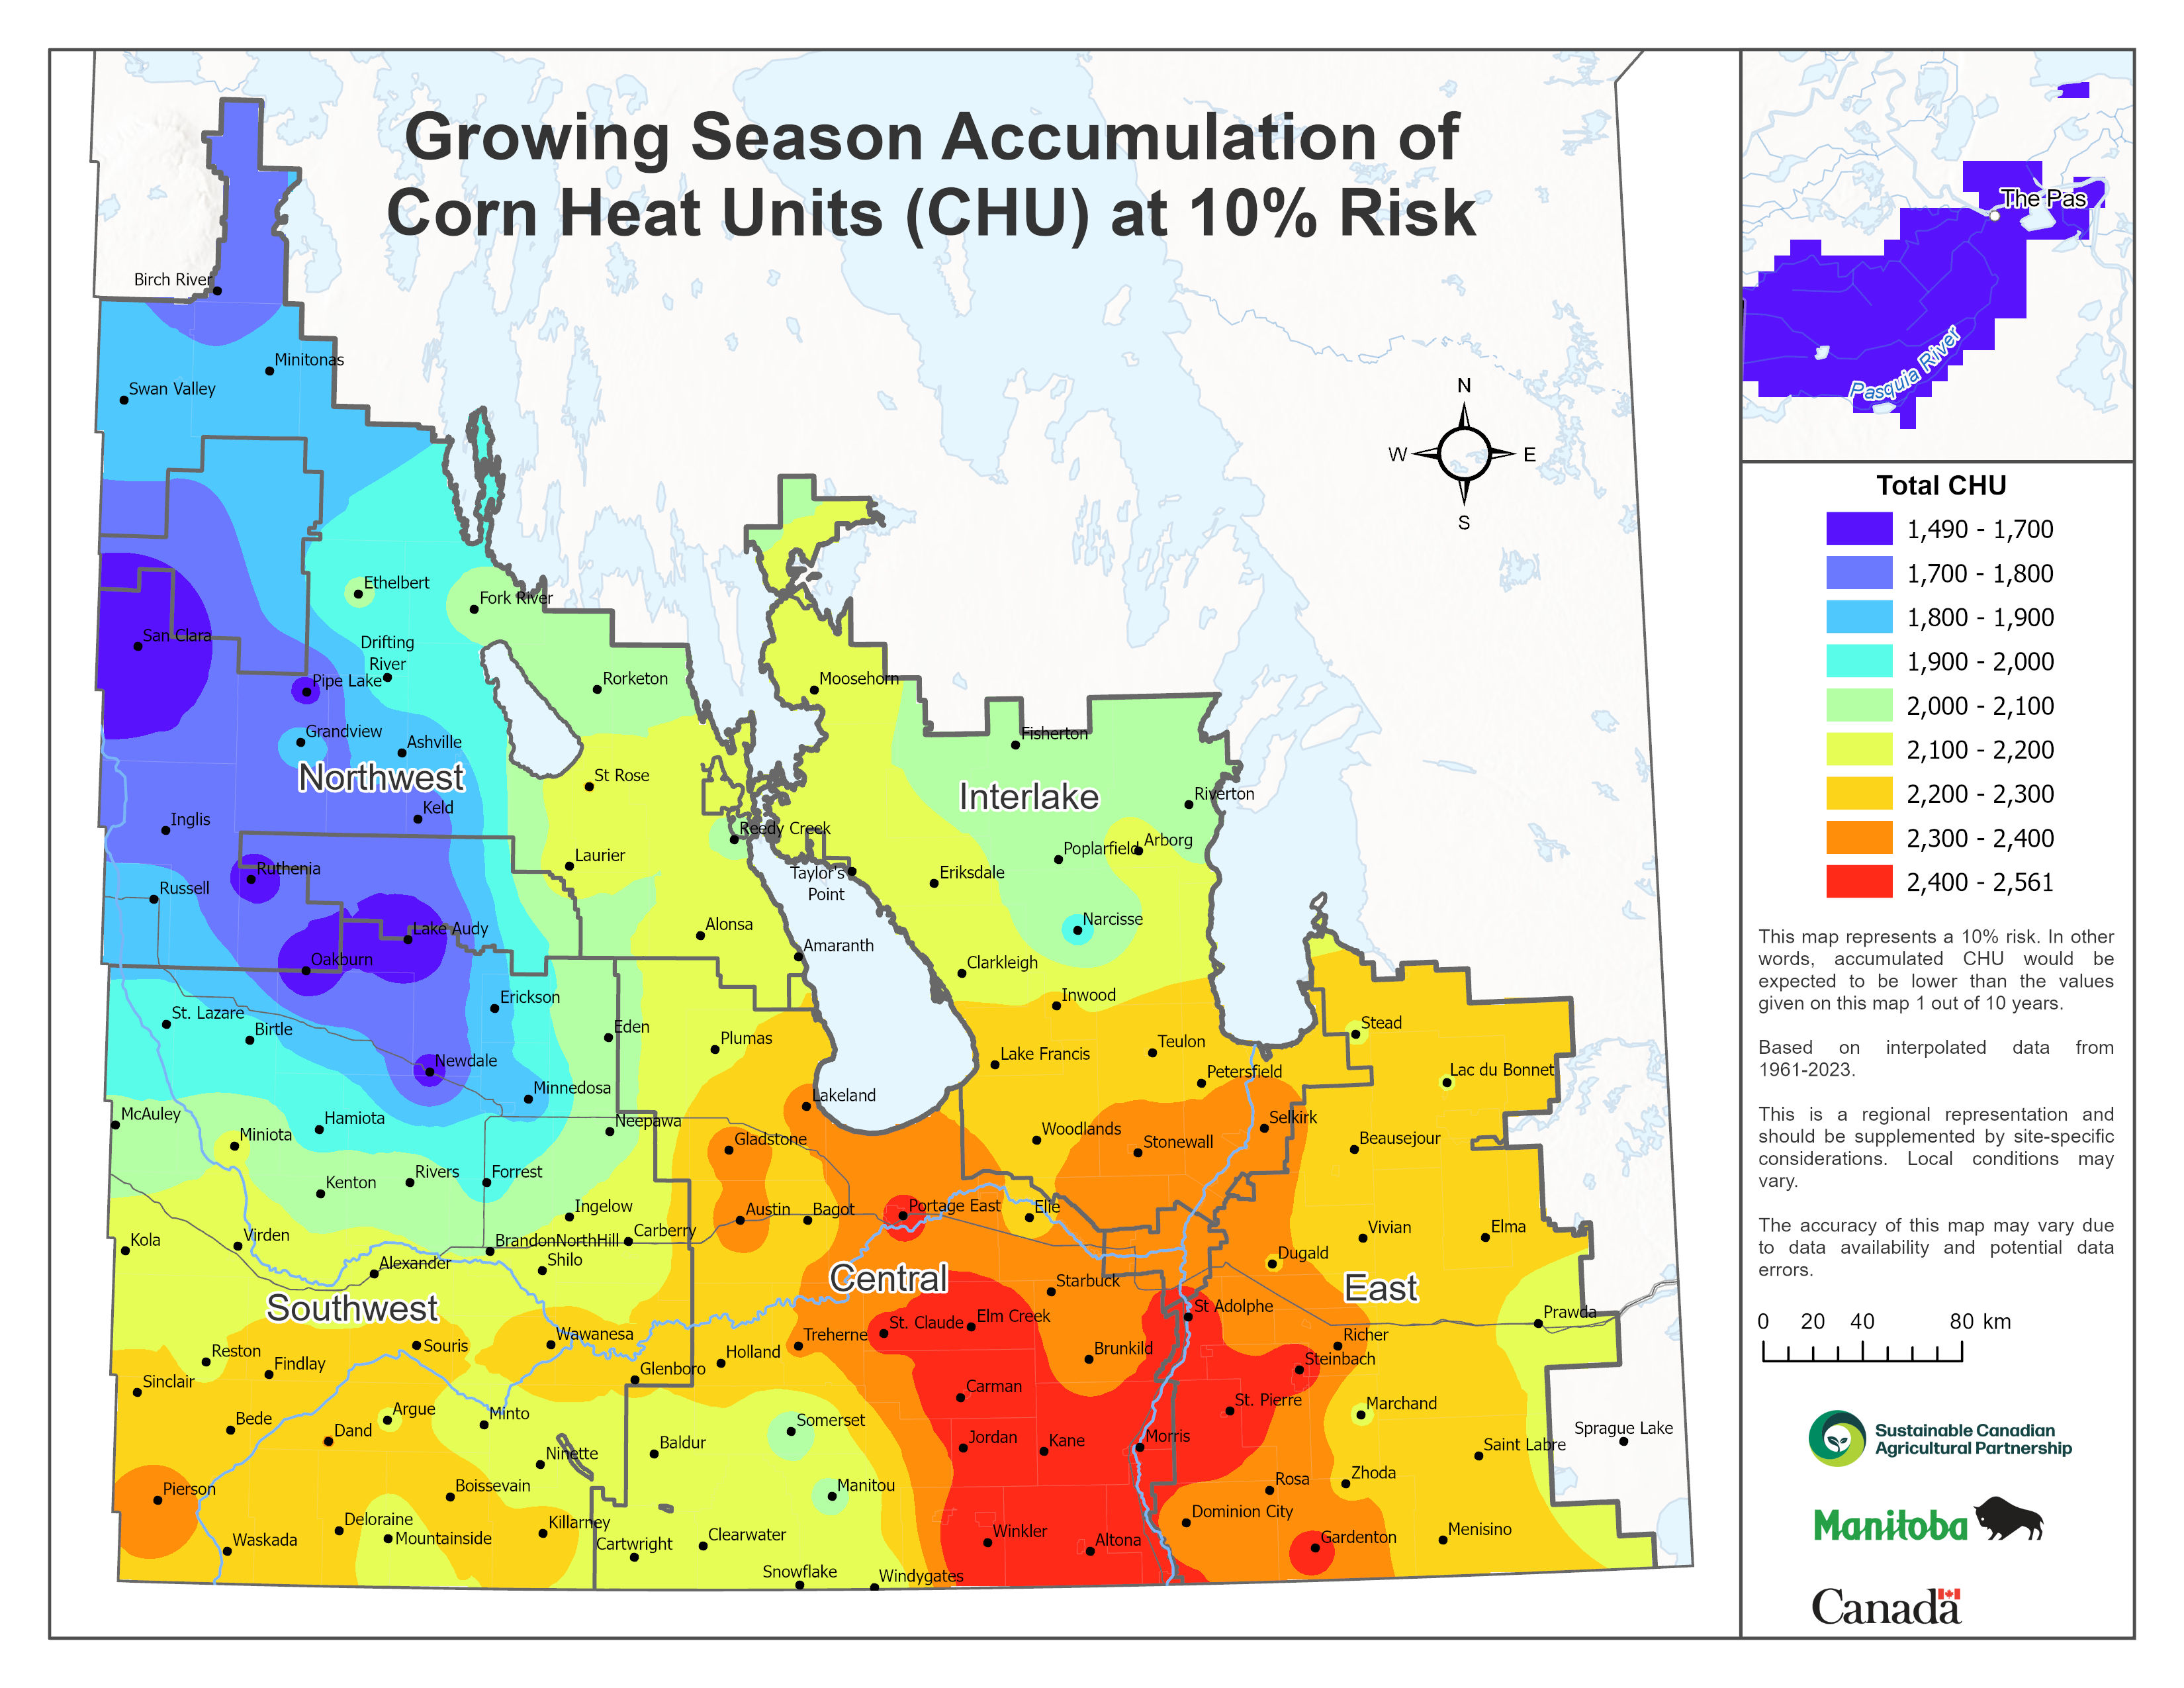
Assessment of minimum CHU accumulation at a 10 percent risk level (Figure 22) shows that most of the Southwest, Central, and Eastern regions will mature a 2,200 CHU rating hybrid to the grain stage nine out of 10 years.
Physiological Days for Potatoes (P-days)
In recent years, potato production has become increasingly important to Manitoba’s agricultural industry and to the provincial economy. As a result, the heat requirements for potatoes have been studied in some detail. Studies on the response of potatoes to temperature have lead to the development of the physiological day or P-day.
Potatoes possess very specific heat requirements. The minimum temperature for growth and development is 7° C (45° F) and the most rapid growth and development occurs at 21° C (70° F). The growth rate decreases with increasing temperature above 21° C (70° F) and finally stops at 30° C (86° F). From this information P-days can be calculated.
P-days calculation:
The accumulation of heat useful to potatoes, P-days, was calculated from historical climatic data. It was assumed that potatoes were planted on the same date as wheat, thus historical wheat seeding dates from Statistics Canada were used. P-days were calculated from those planting dates to the date of the first fall frost. In these calculations, daily data for the period 1961 to 2023 from over 120 climatic weather stations in Manitoba were used.
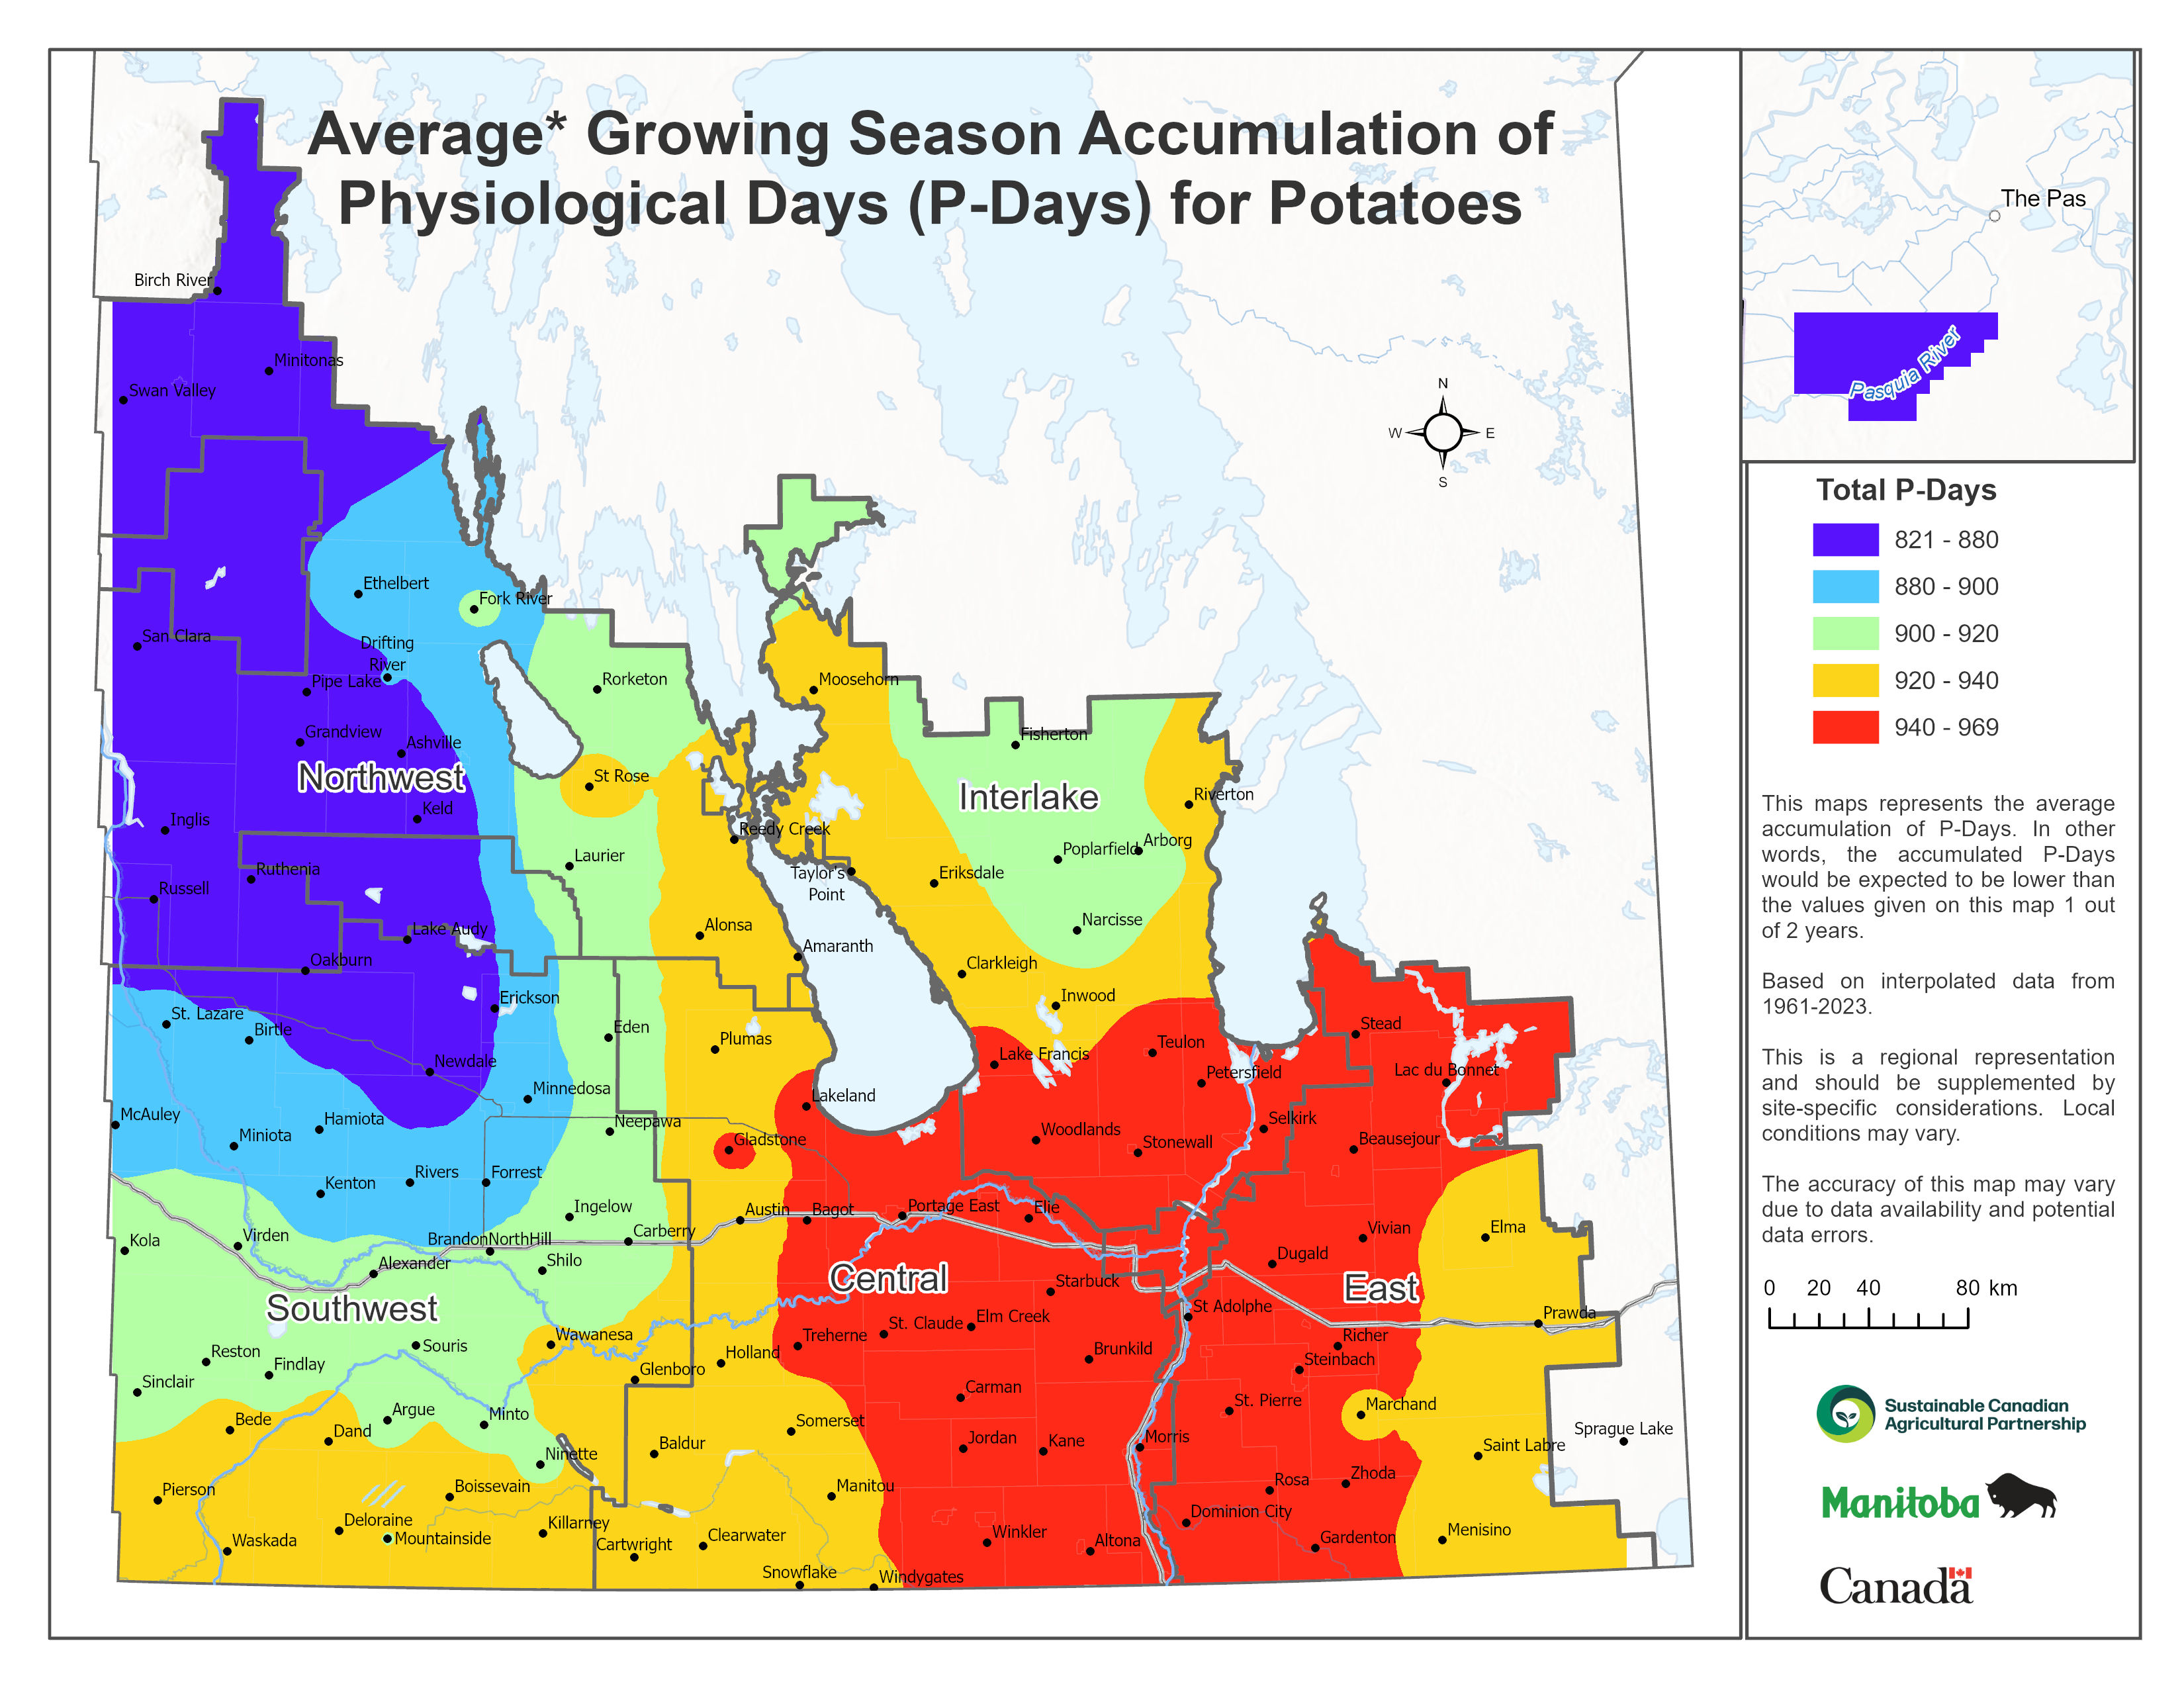
The highest average accumulation of P-days, 940 - 969, occurs in the very southern part of the Red River Valley extending from south of Dominion City through to Altona and north-west of Morden. There is also a few smaller areas just to the east of and around Portage la Prairie, around Selkirk and around Beausejour (Figure 23). Most of the area to the south and east of a line from the southern end of Lake Manitoba to a point just to the west of Melita accumulates 920 - 940 average annual P-days.
It is important to note that not all of the most southerly parts of the province have the highest P-day accumulations. For example, the area to the south and west of Melita does not have any more P-days than the area near Carberry, some distance to the north. In fact, it is elevation and not latitude that seems to be the most important factor influencing P-days. Going west from the Red River along the U.S. border, one finds areas of low P-days near Pilot Mound in the municipality of Louise and the Turtle Mountain region near Boissevain. Both these areas are at a higher elevation than nearby areas. At these locations, the fall frosts occur earlier, putting an end to the growing season, the date on which P-day calculations are stopped.
The effects of elevation can be seen even more dramatically in the Riding Mountain and Duck Mountain regions. These have much lower P-day accumulations than areas to the east.
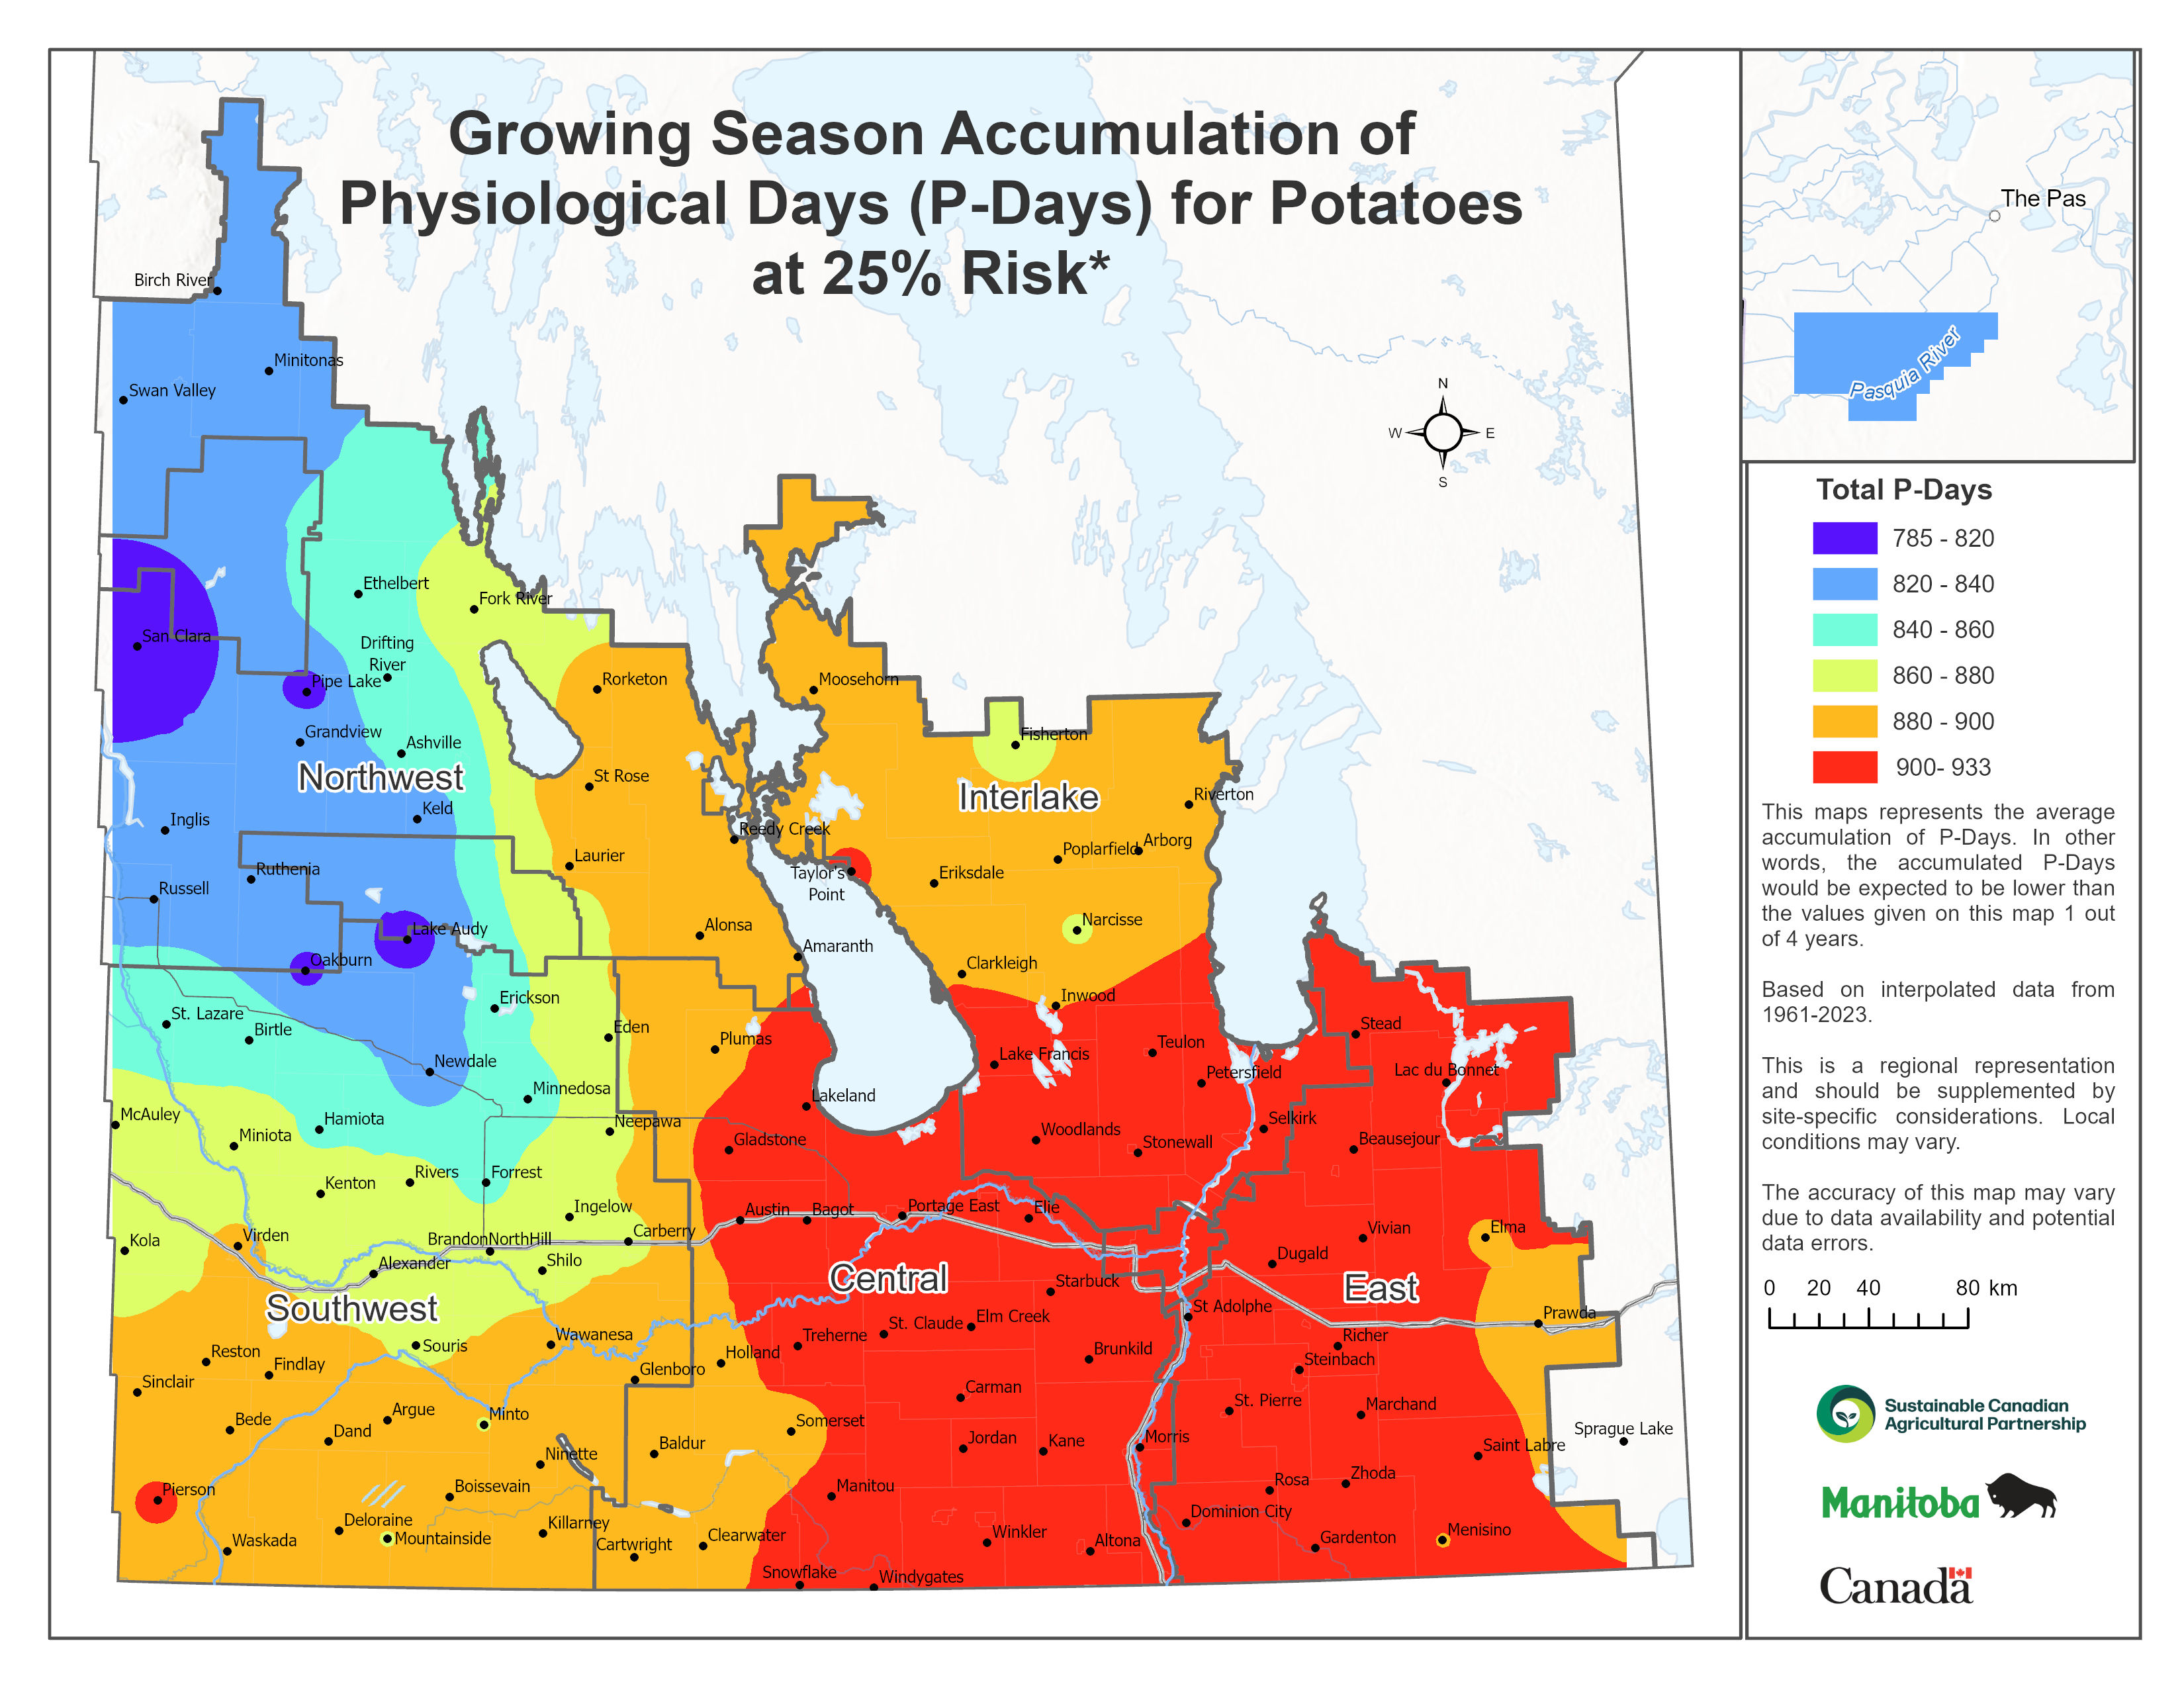
At the 25 percent risk level (one-in-four year occurrence, Figure 24) the areas through the majority of the Central and Eastern regions and the southern area of the Interlake accumulate 900 - 933 P-days. The effects of elevation are again clearly illustrated.
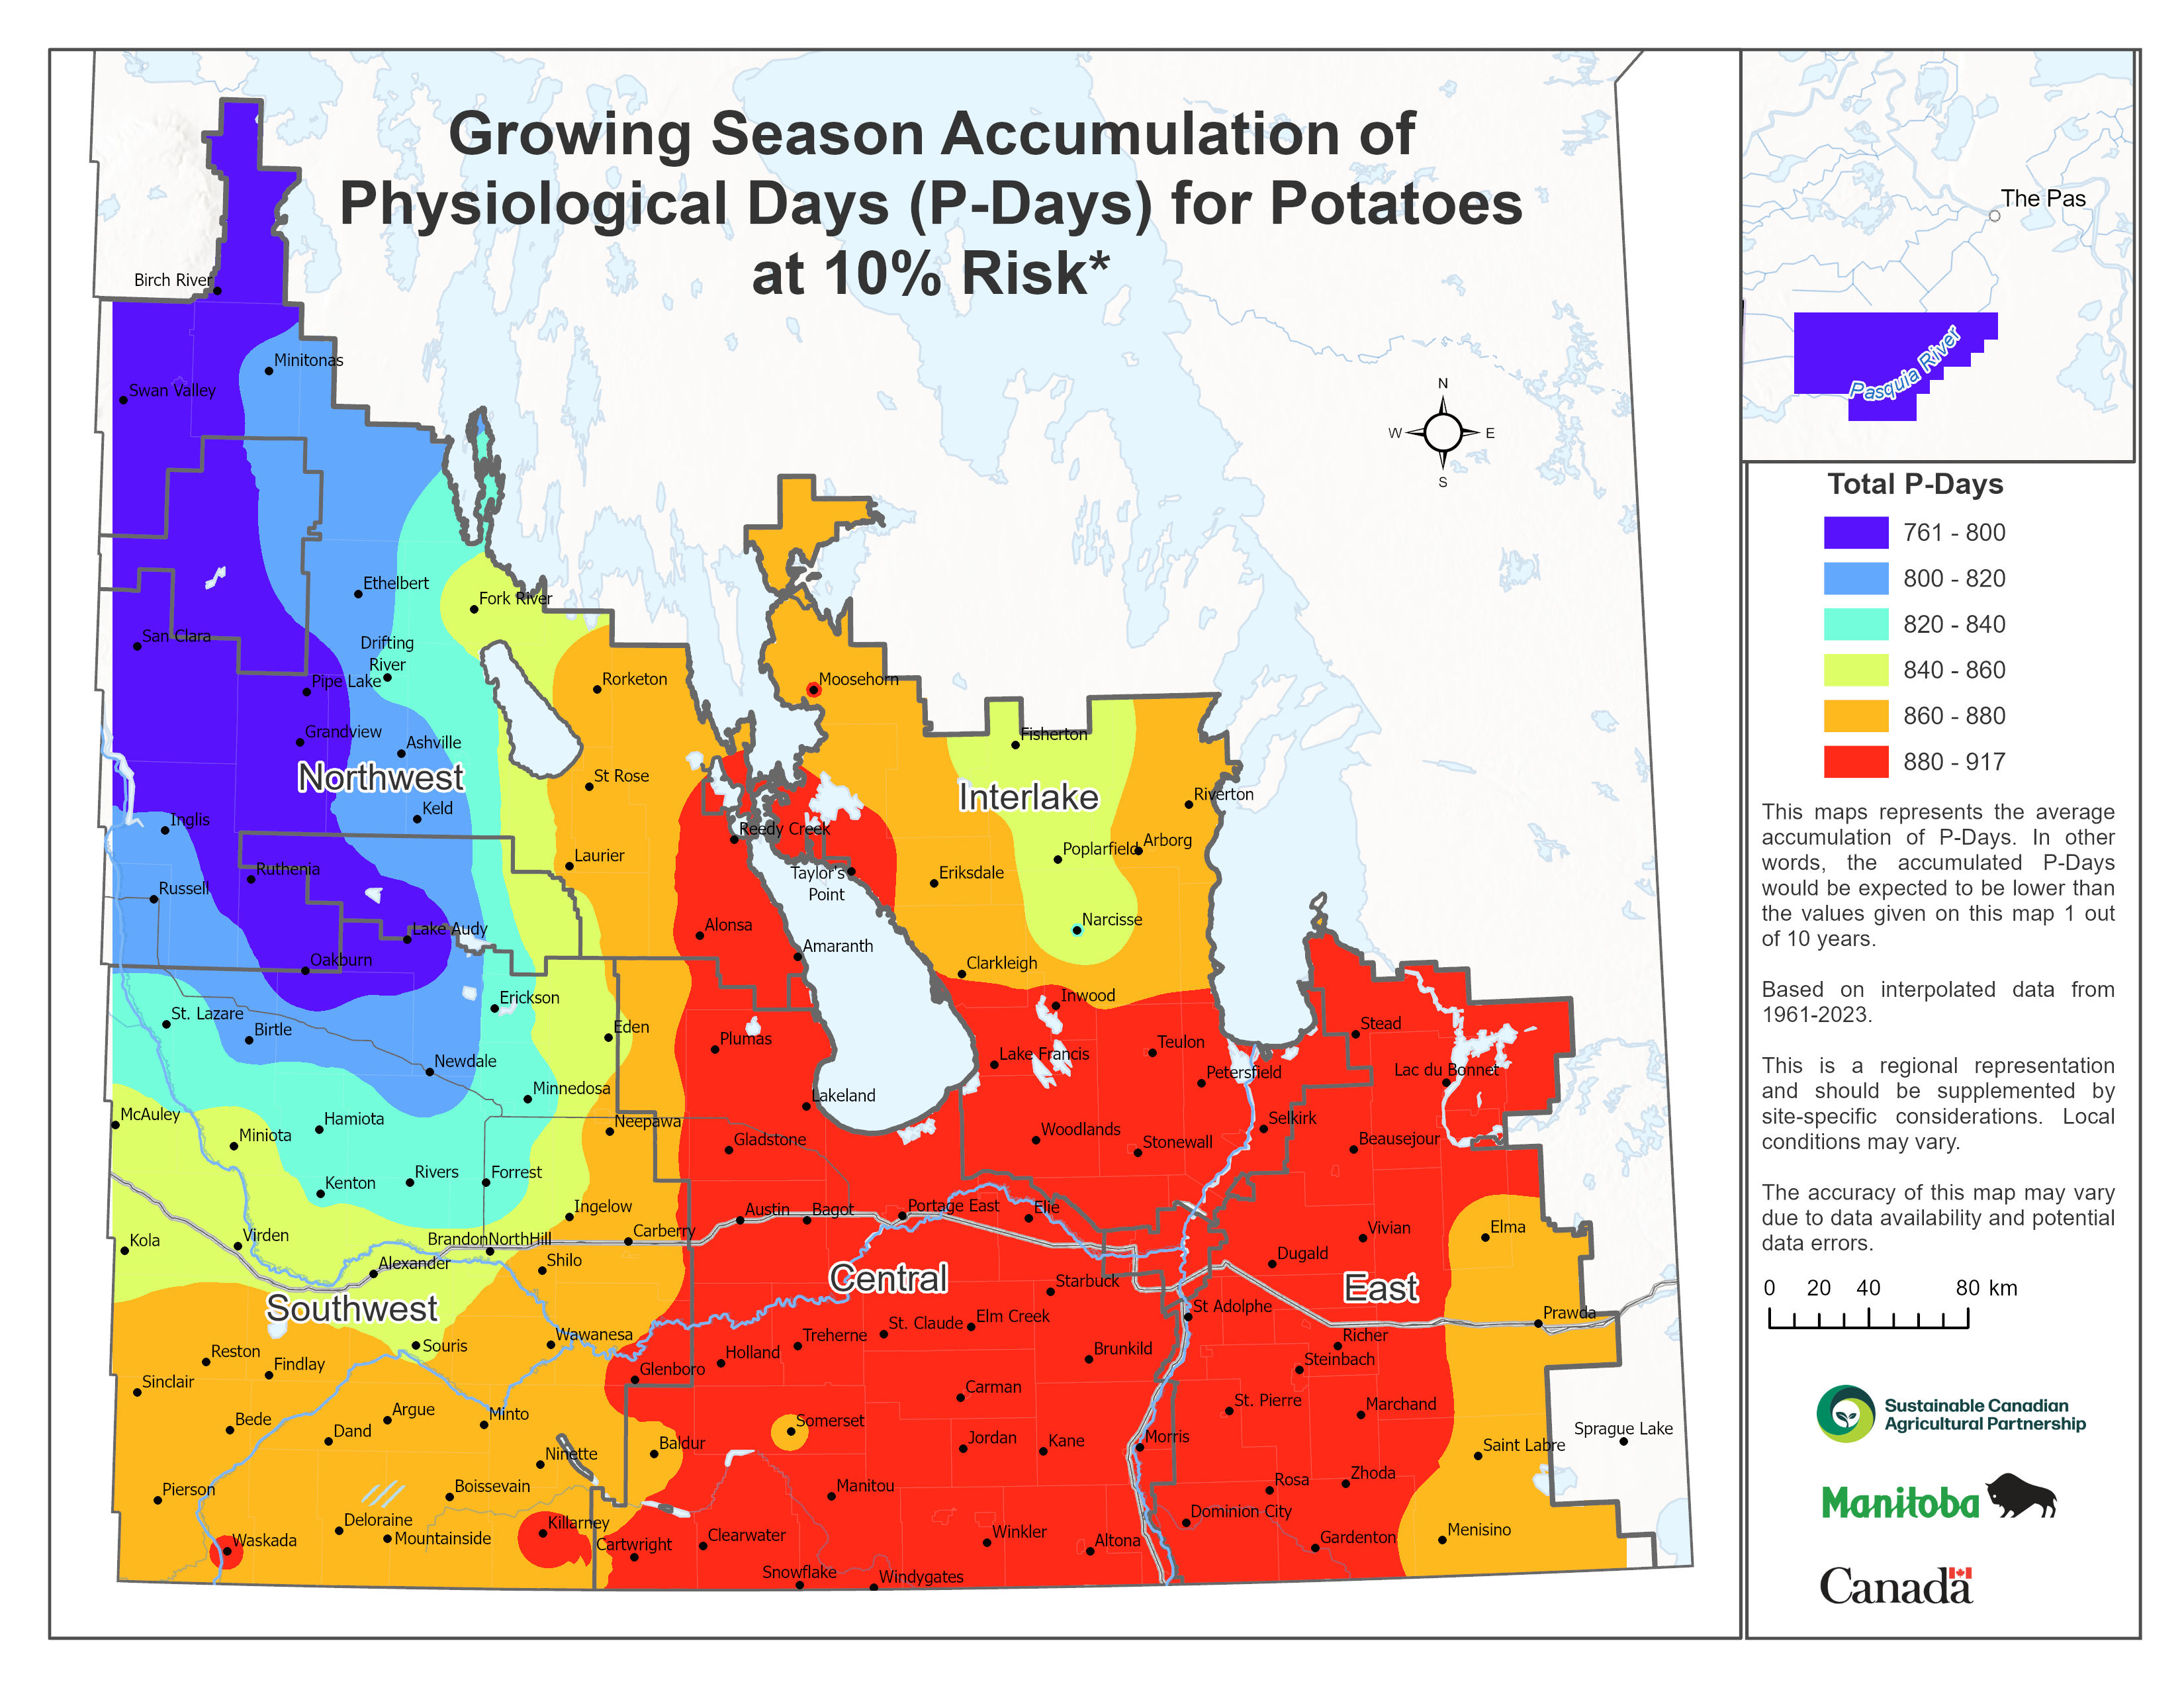
At the 10 percent risk level (one-in-ten year occurrence, Figure 25), again only the Central region, parts of the Eastern region, and the southern portion of the Interlake receive 880-917 P-days. Otherwise, the relative distribution of P-days is the same as it was for the 25 percent map.
Moisture
While heat availability determines the probability that a crop will reach maturity in a region, heat and moisture availability establishes yield potential. Moisture availability is assessed using a "budgeting" approach.
This approach is based on:
- crop water demand; that is, if a particular crop were to have an unlimited supply of water, how much would it use;
- water supplied by growing season precipitation (seeding to maturity);
- water available in the soil at the beginning of the growing season;
- and the difference between crop water demand and total precipitation and soil moisture (shortfall or stress).
This report assesses moisture availability for three crop types:
- perennial forage crops, represented by alfalfa;
- cereal and oilseed crops, represented by spring wheat; and
- "long season" crops, represented by corn.
Forage Crops – Alfalfa
Crop Water Demand
Plant growth requires very large amounts of water. The amount of water that would be used, if supply were unlimited, is referred to as "growing season crop water demand". Daily crop water demand depends on weather, the crop type and its stage of development.
Potential evapotranspiration (PE) is the maximum water use for a given set of weather conditions. Crop water demand depends upon two factors: PE and the fraction of ground area covered by leaves. For annual crops like wheat, leaf area varies with the stage of development. With perennial forage crops, like alfalfa, the ground is completely covered with actively growing leaves early in spring and remains covered throughout most of the growing season. Therefore, crop water demand for perennial forage is approximately equal to PE. On average, this amounts to 400 to 450 mm (16 to 18 in.) per year (Figure 26).
Growing Season Precipitation
The growing season to a second cut of alfalfa is approximately April 15 to August 15. Average precipitation for this period varies from about 190 mm to 220 mm(7½ to 8½ in.) in the Red River Valley to 275 mm (11 in.) in the Interlake regions of Manitoba (Figure 27). A comparison of this map with that for water demand (Figure 26) shows that, on average, growing season rain supplies only about half the water demand for perennial forage crops.
Year-to-year variation in growing season precipitation is very large. The 25 percent risk values are about 50 mm (2 in.) above and below the average values. For example, in the Red River Valley, one year in four will have 150 mm (6 in.) or less growing season rainfall. Similarly, one year in four will have 250 mm (10 in.) or more growing season precipitation.
Moisture Stress - Forage Crops
The average moisture shortfall or stress at the first cut of alfalfa (Figure 28) varies between -10 mm (-½ in.) in the Gimli and Vogar regions to over -75 mm (-3 in.) in south-western Manitoba. These figures suggest that on average, 25 to 100 mm (1 to 4 in.) of additional water are necessary for maximum alfalfa yield. In some areas, this may be supplied by irrigation.
The 25 percent risk map shows that for one year in four, most of south-western Manitoba requires 80 to 120 mm (3 to 5 in.) of additional water to yield maximum dry matter (Figure 29).
By the second cut of alfalfa, average shortfall has substantially increased in all regions (Figure 30). In Manitoba, 110 to 210 mm (4½ to 8 in.) of additional water is required, on average, to eliminate plant moisture stress. In one year in four, depending upon location, a producer would need to provide 90 to 250 mm (3½ to 10 in.) of additional water to maintain maximum production of the second cut of alfalfa (Figure 31). Without irrigation, the probability of obtaining quality and quantity yields from the second cut of alfalfa for most of Manitoba is low.
Cereal and Oilseed Crops – Spring Wheat
For purposes of this publication, it is assumed that wheat is grown continuously, that is, the fields are never in fallow.
Crop Water Demand
Crop water demand varies from 30 to 100 percent of potential evapotranspiration (PE) during the various stages of wheat development. From planting to emergence, water demand is about 30 percent of PE. As the crop develops, expanding leaf area increases the demand for water. As soon as the ground is completely covered by the crop, water is required at the potential rate 100 percent of PE.
From planting to maturity, a wheat crop in Manitoba requires an average of 275 to 325 mm (11 to 13 in.) of water (Figure 32). Demand is lowest in the Interlake region of Manitoba and highest in south-western Manitoba. There is only a small year-to-year variability in crop water demand by wheat.
Growing Season Precipitation
The growing season is defined as the period from planting to crop maturity. Recorded planting dates usually range from April 30 to May 20. On average, wheat usually matures between August 11 and 22. Thus, the growing season precipitation is that which falls over a period of 100 to 120 days. In this study, growing season precipitation for each year occurred between the actual planting date and the maturity date for that year, as estimated by phenological development derived by temperature. These annual values were totalled to calculate the average and risk values.
The highest average growing season rainfall (Figure 33) occurs in the extreme south-eastern portion of the province, as well as in the Peace Gardens-Boissevain and the Hodgson-Arborg regions, recording 220 to 250 mm (8½ to 10 in.). The area around Virden, the western Interlake and the Westlake regions receive slightly less than 200 mm (8 in.). The rest of Manitoba receives an average of 200 to 225 mm (8 to 9 in.) of precipitation. For all locations, average growing season rainfall meets about two-thirds of the crop’s growing season demand.
Growing season rainfall is characterised by very large year-to-year and location-to-location variability. Manitoba can expect 150 to 200 mm (6 to 9 in.) or less rain in the driest 25 percent of years (Figure 34). Overall, there is a 25 percent risk that growing season precipitation will be about 50 to 75 mm (2 to 3 in.) less than average.
Over the long term, 230 to 300 mm (9 to 12 in.) or more rain will fall over the growing season in one in every four years (Figure 35). This amount is about 100 to 125 mm (4 to 5 in.) more than in the dry years. In these years, the likelihood of reduced yields is minimal, especially if the rain is evenly distributed throughout the growing season. However, these years are not without their problems; examples of which are flooding damage to growing crops and excessively wet harvest conditions.
Plant-Available Soil Moisture at Seeding
Together with growing season precipitation, plant-available soil moisture at seeding makes up the total amount of water available for crop production in any year. Soil moisture is recharged by fall rains, snowmelt and spring rain prior to planting. The available water-holding capacity of soil varies with soil type: a coarse-textured soil can hold about 175 mm (7 in.) of available water to a depth of 1.2 m (4 ft.) while medium and fine-textured soils can hold 225 to 250 mm (9 to 10 in.).
The map of average available soil moisture at planting shows large regional variation (Figure 36). In Manitoba's Red River Valley and eastern Interlake regions, average available moisture at planting time is about 200 mm (8 in.). This is very near the water-holding capacity of these soils. Therefore, in these areas, summerfallowing would not significantly increase soil moisture at planting.
The area to the west of the Manitoba escarpment has about 175 mm (7 in.) of available soil moisture at planting. This is only about 60 percent of available water holding capacity. (Note: this estimate is based on continuously cropped wheat with no years of summerfallow.)
The one-in-four-year risk map of plant-available water at seeding (Figure 37) shows the same geographic pattern, but the values are 25 to 50 mm (1 to 2 in.) lower than average.
Moisture Stress - Wheat
The difference between the amount of water a crop can potentially use and the amount it actually gets from planting to maturity, is the moisture shortfall or "stress." Both the magnitude and timing of moisture stress are important. For Spring Wheat, yields are determined largely by plant moisture stress during the heading and soft dough stages of development.
Average plant moisture stress from planting to heading varies from nearly zero in the Red River Valley and Interlake regions to over -20 mm (-1 in.) near Ashern, Carberry, and the extreme south-western corner of the province (Figure 38). The 25 percent risk map shows a moisture stress of -15 to -40 mm (-½ to 1½ in.) or more in most of Manitoba (Figure 39).
These geographic differences in moisture stress have important implications. Studies in southern Saskatchewan have shown that every millimeter of water used by a wheat crop increases yield by 9 kg/ha (0.13 bu/ac). Thus, the difference of 25 mm in moisture stress between central and south-western Manitoba translates into a yield difference of 225 kg/ha (3.3 bu/ac).
By the soft dough stage, plant moisture stress has increased (Figure 40). The average values at this stage are the same as those on the 25 percent risk map at the heading stage.
Long Season Crops — Corn
Corn, sunflowers, potatoes and field beans are examples of "long season crops." For this publication, corn will be used. While the moisture situation for the other crops is not identical to that of corn, it is certainly similar.
Crop Water Demand
Since the growing season for corn is longer than that for wheat, growing season water demand is also larger. It varies from 375 mm (15 in.) in the Red River Valley to 450 mm (17 in.) in south-western Manitoba (Figure 41).
Growing Season Precipitation
Because the growing season for corn is somewhat longer than that for wheat, the amount of rain that falls during the growing season for corn is about 50 mm (2 in.) more than that for wheat (Figure 42). Values range from 230 mm (10 in.) to 270 mm (12 in) in most of Manitoba. The map shows that in an average year, about 70 percent of the water demand by corn is met by growing season rainfall in the Red River Valley.
Moisture Stress - Grain Stage
In an average year, soil moisture stress at the grain stage varies from -75 mm (-3 in.) in the Red River Valley to -125 mm (-5 in.) in south-western Manitoba (Figure 43). These are significant shortfalls and indicate that water supply severely limits the potential for grain corn production in Manitoba.
Summary of All Maps
Heat
Last Spring Frost
- Figure 2: Average Date of the Last Spring Frost at 0° C
- Figure 3: 25 Percent Risk Date of the Last Spring Frost at 0° C
- Figure 4: 10 Percent Risk Date of the Last Spring Frost at 0° C
First Fall Frost
- Figure 5: Average Date of the First Fall Frost at 0° C
- Figure 6: 25 Percent Risk Date of the First Fall Frost at 0° C
- Figure 7: 10 Percent Risk Date of the First Fall Frost at 0° C
Frost-free Length
- Figure 8: Average Length of the Frost-free Period Above 0° C
- Figure 9: Length of the Frost-free Period Above 0° C at a 25 Percent Risk
- Figure 10: Length of the Frost-free Period Above 0° C at a 10 Percent Risk
Accumulation of Growing Degree Days (GDD)
- Figure 11: Average Annual Accumulation of GDD Above 5° C
- Figure 12: Annual Accumulation of GDD Above 5° C at a 25 Percent Risk
- Figure 13: Annual Accumulation of GDD Above 5° C at a 10 Percent Risk
- Figure 14: Average Annual Accumulation of GDD Above 10° C
- Figure 15: Annual Accumulation of GDD Above 10° C at a 25 Percent Risk
- Figure 16: Annual Accumulation of GDD Above 10° C at a 10 Percent Risk
- Figure 17: Average Annual Accumulation of GDD Above 15° C
- Figure 18: Annual Accumulation of GDD Above 15° C at a 25 Percent Risk
- Figure 19: Annual Accumulation of GDD Above 15° C at a 10 Percent Risk
Corn Heat Units (Accumulation)
- Figure 20: Average Annual Accumulation of Corn Heat Units
- Figure 21: Annual Accumulation of Corn Heat Units at a 25 Percent Risk
- Figure 22: Annual Accumulation of Corn Heat Units at a 10 Percent Risk
- Figure 23: Average Annual Accumulation of P-Days
- Figure 24: Annual Accumulation of P-Days at a 25 Percent Risk
- Figure 25: Annual Accumulation of P-Days at a 10 Percent Risk
Moisture
Alfalfa
- Figure 26: Average Crop Water Demand to the Second Cut of Alfalfa (mm)
- Figure 27: Average Accumulated Precipitation to the Second Cut of Alfalfa (mm)
- Figure 28: Average Plant Moisture Stress at the First Cut of Alfalfa (mm)
- Figure 29: 25 Percent Risk of Plant Moisture Stress at the First Cut of Alfalfa (mm)
- Figure 30: Average Plant Moisture Stress at the Second Cut of Alfalfa (mm)
- Figure 31: 25 Percent Risk of Plant Moisture Stress at the Second Cut of Alfalfa (mm)
Spring Wheat
- Figure 32: Average Growing Season Crop Water Demand for Spring Wheat (mm)
- Figure 33: Average Growing Season Precipitation for Spring Wheat (mm)
- Figure 34: Lower 25 Percent of Growing Season Precipitation for Spring Wheat (mm)
- Figure 35: Upper 25 Percent of Growing Season Precipitation for Spring Wheat (mm)
- Figure 36: Average Soil Moisture Amounts at Planting for Spring Wheat (mm)
- Figure 37: 25 Percent Risk of Soil Moisture Amounts at Planting for Spring Wheat (mm)
- Figure 38: Average Plant Moisture Stress at Heading for Spring Wheat (mm)
- Figure 39: 25 Percent Risk of Plant Moisture Stress at Heading for Spring Wheat (mm)
- Figure 40: Average Plant Moisture Stress at the Soft Dough Stage of Spring Wheat (mm)
Corn
- Figure 41: Average Growing Season Crop Water Demand for Corn (mm)
- Figure 42: Average Growing Season Precipitation for Corn (mm)
- Figure 43: Average Plant Moisture Stress at the Grain Stage of Corn (mm)
Map Limitations
The maps presented in this publication should be used with some caution. Some parts of the map may not be very reliable because they have few weather stations. For example, next to the Saskatchewan border there are 12 municipalities – Albert, Cameron, Whitewater, Pipestone, Sifton, Glenwood, Oakland, Wallace, Woodworth, Whitehead, Daly, Archie and Miniota – without a single weather station (Figure 1). Values in these areas have been estimated by interpolation of data from weather stations outside the municipalities. As a result, the map is not as reliable in this area as it is in areas with a higher weather station density.
Another important issue is the representativeness of the weather data. This is particularly important when considering location near lakes or rivers. For example, the weather station at Great Falls on the Winnipeg River has a higher heat accumulation than the surrounding area. This is likely the result of a longer frost-free period recorded at that particular weather station. Although there is no question about the accuracy of the observations made at the weather station, the data may not be representative of the surrounding area because the influence of the river on the weather may extend for only a short distance from the river. As a result, the map probably overestimates the thermal values for that area.
The following examples show how to use the maps in this publication. Climatic parameters are identified on each map by different colours. Each colour represents an area in which the value of a climatic parameter falls within a given range.
For Example, Figure 2 shows the average date of occurrence of the last spring frost at 0° C. To determine this date for Altona (south of the city of Winnipeg, near the Manitoba-U. S. border), note that the zone which Altona is located in is coloured red. Therefore, according to the map’s legend, the average date of the last spring frost at Altona occurs from May 14 to May 19.
For another example, review Figure 30. This map shows the average growing season precipitation for spring wheat. Consider the zone surrounding Souris. This area is coloured light green, and according to the map’s legend, receives 200 to 210 mm of growing season precipitation.
For more information, contact your local Manitoba Agriculture Office.